Berkshire Hathaway 2005 Annual Report Download - page 56
Download and view the complete annual report
Please find page 56 of the 2005 Berkshire Hathaway annual report below. You can navigate through the pages in the report by either clicking on the pages listed below, or by using the keyword search tool below to find specific information within the annual report.-
 1
1 -
2
-
3
-
4
-
5
-
6
-
7
-
8
-
9
-
10
-
11
-
12
-
13
-
14
-
15
-
16
-
17
-
18
-
19
-
20
-
21
-
22
-
23
-
24
-
25
-
26
-
27
-
28
-
29
-
30
-
31
-
32
-
33
-
34
-
35
-
36
-
37
-
38
-
39
-
40
-
41
-
42
-
43
-
44
-
45
-
 46
46 -
 47
47 -
 48
48 -
 49
49 -
 50
50 -
 51
51 -
 52
52 -
 53
53 -
 54
54 -
 55
55 -
 56
56 -
 57
57 -
 58
58 -
 59
59 -
 60
60 -
 61
61 -
 62
62 -
 63
63 -
 64
64 -
 65
65 -
 66
66 -
67
-
68
-
69
-
70
-
71
-
72
-
73
-
74
-
75
-
76
-
77
-
78
-
79
-
80
-
81
-
82
 |
 |

55
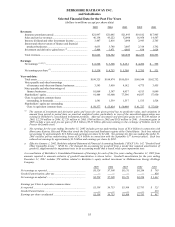
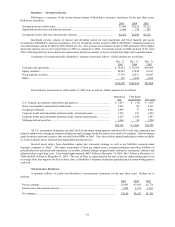
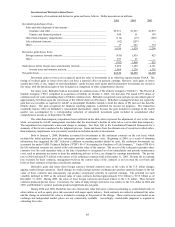
BERKSHIRE HATHAWAY INC.
and Subsidiaries
Selected Financial Data for the Past Five Years
(dollars in millions except per share data)
2005 2004 2003 2002 2001
Revenues:
Insurance premiums earned.................................................... $21,997 $21,085 $21,493 $19,182 $17,905
Sales and service revenues ..................................................... 46,138 43,222 32,098 16,958 14,507
Interest, dividend and other investment income ..................... 3,487 2,816 3,098 2,943 2,765
Interest and other revenues of finance and financial
products businesses .............................................................
4,633
3,788
3,087
2,314
1,792
Investment and derivative gains/losses (1)............................... 5,408 3,471 4,083 838 1,624
Total revenues ........................................................................ $81,663 $74,382 $63,859 $42,235 $38,593
Earnings:
Net earnings (1) (2) (3) ................................................................ $ 8,528 $ 7,308 $ 8,151 $ 4,286 $ 795
Net earnings per share (3) ........................................................ $ 5,538 $ 4,753 $ 5,309 $ 2,795 $ 521
Year-end data:
Total assets ............................................................................. $198,325 $188,874 $180,559 $169,544 $162,752
Notes payable and other borrowings
of insurance and other non-finance businesses.................... 3,583 3,450 4,182 4,775 3,455
Notes payable and other borrowings of
finance businesses............................................................... 10,868 5,387 4,937 4,513 9,049
Shareholders’ equity............................................................... 91,484 85,900 77,596 64,037 57,950
Class A equivalent common shares
outstanding, in thousands .................................................... 1,541 1,539 1,537 1,535 1,528
Shareholders’ equity per outstanding
Class A equivalent common share ...................................... $ 59,377 $ 55,824 $ 50,498 $ 41,727 $ 37,920
(1) The amount of investment and derivative gains and losses for any given period has no predictive value, and variations in
amount from period to period have no practical analytical value, particularly in view of the unrealized appreciation now
existing in Berkshire's consolidated investment portfolio. After-tax investment and derivative gains were $3,530 million in
2005, $2,259 million in 2004, $2,729 million in 2003, $566 million in 2002 and $923 million in 2001. Investment gains in
2005 include a non-cash pre-tax gain of $5.0 billion ($3.25 billion after-tax) relating to the exchange of Gillette stock for
Procter & Gamble stock.
(2) Net earnings for the year ending December 31, 2005 includes pre-tax underwriting losses of $3.4 billion in connection with
Hurricanes Katrina, Rita and Wilma that struck the Gulf coast and Southeast regions of the United States. Such loss reduced
net earnings by approximately $2.2 billion and earnings per share by $1,446. Net earnings for the year ending December 31,
2001 includes pre-tax underwriting losses of $2.4 billion in connection with the September 11th terrorist attack. Such loss
reduced net earnings by approximately $1.5 billion and earnings per share by $982.
(3) Effective January 1, 2002, Berkshire adopted Statement of Financial Accounting Standards (“SFAS”) No. 142 “Goodwill and
Other Intangible Assets.” SFAS No. 142 changed the accounting for goodwill from a model that required amortization of
goodwill, supplemented by impairment tests, to an accounting model that is based solely upon impairment tests.
A reconciliation of Berkshire’s Consolidated Statements of Earnings for each of the five years ending December 31, 2005 from
amounts reported to amounts exclusive of goodwill amortization is shown below. Goodwill amortization for the year ending
December 31, 2001 includes $78 million related to Berkshire’s equity method investment in MidAmerican Energy Holdings
Company.
2005 2004 2003 2002 2001
Net earnings as reported........................................................... $8,528 $7,308 $8,151 $4,286 $ 795
Goodwill amortization, after tax ............................................... — — — — 636
Net earnings as adjusted ........................................................... $8,528 $7,308 $8,151 $4,286 $ 1,431
Earnings per Class A equivalent common share:
As reported................................................................................ $5,538 $4,753 $5,309 $2,795 $ 521
Goodwill amortization............................................................... — — — — 416
Earnings per share as adjusted................................................. $5,538 $4,753 $5,309 $2,795 $ 937