Berkshire Hathaway 2005 Annual Report Download - page 12
Download and view the complete annual report
Please find page 12 of the 2005 Berkshire Hathaway annual report below. You can navigate through the pages in the report by either clicking on the pages listed below, or by using the keyword search tool below to find specific information within the annual report.-
 1
1 -
 2
2 -
 3
3 -
 4
4 -
 5
5 -
 6
6 -
 7
7 -
 8
8 -
 9
9 -
 10
10 -
 11
11 -
 12
12 -
 13
13 -
 14
14 -
 15
15 -
 16
16 -
 17
17 -
 18
18 -
 19
19 -
 20
20 -
 21
21 -
 22
22 -
23
-
24
-
25
-
26
-
27
-
28
-
29
-
30
-
31
-
32
-
33
-
34
-
35
-
36
-
37
-
38
-
39
-
40
-
41
-
42
-
43
-
44
-
45
-
46
-
47
-
48
-
49
-
50
-
51
-
52
-
53
-
54
-
55
-
56
-
57
-
58
-
59
-
60
-
61
-
62
-
63
-
64
-
65
-
66
-
67
-
68
-
69
-
70
-
71
-
72
-
73
-
74
-
75
-
76
-
77
-
78
-
79
-
80
-
81
-
82
 |
 |

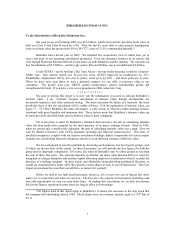
Gen Re’ s trading operation. Both Charlie and I knew at the time of the Gen Re purchase that it was a
problem and told its management that we wanted to exit the business. It was my responsibility to make
sure that happened. Rather than address the situation head on, however, I wasted several years while we
attempted to sell the operation. That was a doomed endeavor because no realistic solution could have
extricated us from the maze of liabilities that was going to exist for decades. Our obligations were
particularly worrisome because their potential to explode could not be measured. Moreover, if severe
trouble occurred, we knew it was likely to correlate with problems elsewhere in financial markets.
So I failed in my attempt to exit painlessly, and in the meantime more trades were put on the
books. Fault me for dithering. (Charlie calls it thumb-sucking.) When a problem exists, whether in
personnel or in business operations, the time to act is now.
The second reason I regularly describe our problems in this area lies in the hope that our
experiences may prove instructive for managers, auditors and regulators. In a sense, we are a canary in this
business coal mine and should sing a song of warning as we expire. The number and value of derivative
contracts outstanding in the world continues to mushroom and is now a multiple of what existed in 1998,
the last time that financial chaos erupted.
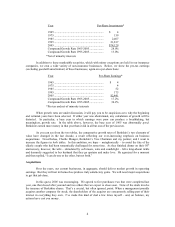
Our experience should be particularly sobering because we were a better-than-average candidate
to exit gracefully. Gen Re was a relatively minor operator in the derivatives field. It has had the good
fortune to unwind its supposedly liquid positions in a benign market, all the while free of financial or other
pressures that might have forced it to conduct the liquidation in a less-than-efficient manner. Our
accounting in the past was conventional and actually thought to be conservative. Additionally, we know of
no bad behavior by anyone involved.
It could be a different story for others in the future. Imagine, if you will, one or more firms
(troubles often spread) with positions that are many multiples of ours attempting to liquidate in chaotic
markets and under extreme, and well-publicized, pressures. This is a scenario to which much attention
should be given now rather than after the fact. The time to have considered – and improved – the reliability
of New Orleans’ levees was before Katrina.
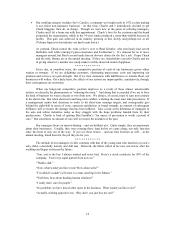
When we finally wind up Gen Re Securities, my feelings about its departure will be akin to those
expressed in a country song, “My wife ran away with my best friend, and I sure miss him a lot.”
* * * * * * * * * * * *
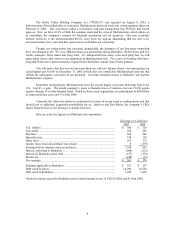
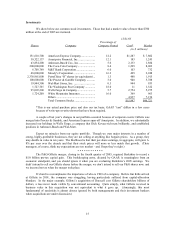
Below are the results of our various finance and financial products activities:
(in $ millions)
Pre-Tax Earnings Interest-Bearing Liabilities
2005 2004 2005 2004
Trading – ordinary income ............................ $ 200 $ 264 $1,061 $5,751
Gen Re Securities (loss) ................................. (104) (44) 2,617* 5,437*
Life and annuity operation ............................. 11 (57) 2,461 2,467
Value Capital (loss) ....................................... (33) 30 N/A N/A
Leasing operations ......................................... 173 92 370 391
Manufactured-housing finance (Clayton)....... 416 192 9,299 3,636
Other............................................................... 159 107 N/A N/A
Income before capital gains............................ 822 584
Trading – capital gains (losses) ..................... (234) 1,750
Total .............................................................. $ 588 $2,334
*Includes all liabilities
11