Berkshire Hathaway 2005 Annual Report Download - page 50
Download and view the complete annual report
Please find page 50 of the 2005 Berkshire Hathaway annual report below. You can navigate through the pages in the report by either clicking on the pages listed below, or by using the keyword search tool below to find specific information within the annual report.-
 1
1 -
2
-
3
-
4
-
5
-
6
-
7
-
8
-
9
-
10
-
11
-
12
-
13
-
14
-
15
-
16
-
17
-
18
-
19
-
20
-
21
-
22
-
23
-
24
-
25
-
26
-
27
-
28
-
29
-
30
-
31
-
32
-
33
-
34
-
35
-
36
-
37
-
38
-
39
-
 40
40 -
 41
41 -
 42
42 -
 43
43 -
 44
44 -
 45
45 -
 46
46 -
 47
47 -
 48
48 -
 49
49 -
 50
50 -
 51
51 -
 52
52 -
 53
53 -
 54
54 -
 55
55 -
 56
56 -
 57
57 -
 58
58 -
 59
59 -
 60
60 -
61
-
62
-
63
-
64
-
65
-
66
-
67
-
68
-
69
-
70
-
71
-
72
-
73
-
74
-
75
-
76
-
77
-
78
-
79
-
80
-
81
-
82
 |
 |

49
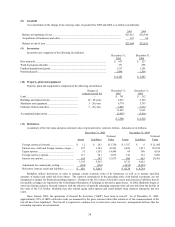
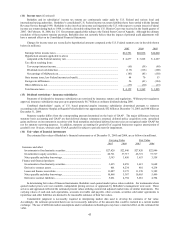
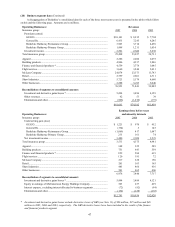
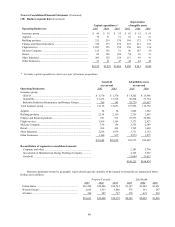
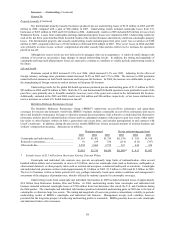
(20) Business segment data (Continued)
Consolidated sales and service revenues in 2005, 2004 and 2003 totaled $46.1 billion, $43.2 billion and $32.1 billion,
respectively. Over 90% of such amounts in each year were in the United States with the remainder primarily in Canada and Europe.
In 2005, consolidated sales and service revenues included $8.7 billion of sales to Wal-Mart Stores, Inc. which were primarily related
to McLane’ s wholesale distribution business that Berkshire acquired in May 2003.
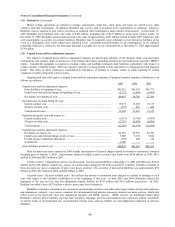
Premiums written and earned by Berkshire’ s property/casualty and life/health insurance businesses are summarized below.
Dollars are in millions.
Property/Casualty Life/Health
2005 2004 2003 2005 2004 2003
Premiums Written:
Direct ........................................................................ $13,582 $11,483 $10,710
Assumed ................................................................... 6,788 8,039 9,227 $2,400 $2,775 $2,517
Ceded ........................................................................ (739) (516) (559) (97) (753) (679)
$19,631 $19,006 $19,378 $2,303 $2,022 $1,838
Premiums Earned:
Direct ........................................................................ $13,287 $11,301 $10,342
Assumed ................................................................... 7,114 8,278 9,992 $2,387 $2,769 $2,520
Ceded ........................................................................ (699) (509) (688) (92) (754) (673)
$19,702 $19,070 $19,646 $2,295 $2,015 $1,847
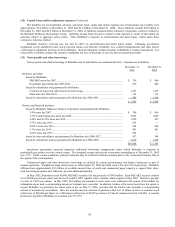
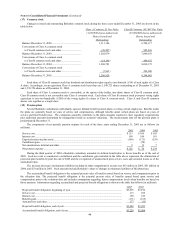
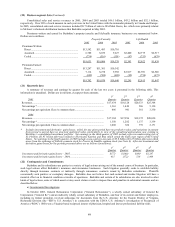
(21) Quarterly data
A summary of revenues and earnings by quarter for each of the last two years is presented in the following table. This
information is unaudited. Dollars are in millions, except per share amounts.
1
s
t2n
d
3
r
d
4
t
h
2005 Quarter Quarter Quarter Quarter
Revenues.............................................................................................................. $17,634 $18,128 $20,533 $25,368
N
et earnings *...................................................................................................... 1,363 1,449 586 5,130
Net earnings per equivalent Class A common share ............................................ 886 941 381 3,330
2004
Revenues.............................................................................................................. $17,184 $17,996 $19,172 $20,030
N
et earnings *...................................................................................................... 1,550 1,282 1,137 3,339
N
et earnings per equivalent Class A common share ............................................ 1,008 834 739 2,171
* Includes investment and derivative gains/losses, which, for any given period have no predictive value, and variations in amount
from period to period have no practical analytical value, particularly in view of the unrealized appreciation now existing in
Berkshire’s consolidated investment portfolio. Net earnings in the third quarter of 2005 include a pre-tax underwriting loss of
$3.0 billion ($1.95 billion after-tax) related to Hurricanes Katrina and Rita which struck the Gulf coast region of the United
States. Net earnings in the fourth quarter of 2005 include a non-cash pre-tax gain of $5.0 billion ($3.25 billion after-tax) which
arose from the exchange of Gillette common stock for Procter & Gamble common stock (see Note 6). After-tax investment and
derivative gains/losses for the periods presented above are as follows (in millions):
1
s
t
2
n
d
3
r
d
4
t
h
Quarter Quarter Quarter Quarter
I
nvestment and derivative gains/losses – 2005.................................................... $(77) $(160) $480 $3,287
I
nvestment and derivative gains/losses – 2004.................................................... 415 (172) 518 1,498
(22) Contingencies and Commitments
Berkshire and its subsidiaries are parties in a variety of legal actions arising out of the normal course of business. In particular,
such legal actions affect Berkshire’ s insurance and reinsurance businesses. Such litigation generally seeks to establish liability
directly through insurance contracts or indirectly through reinsurance contracts issued by Berkshire subsidiaries. Plaintiffs
occasionally seek punitive or exemplary damages. Berkshire does not believe that such normal and routine litigation will have a
material effect on its financial condition or results of operations. Berkshire and certain of its subsidiaries are also involved in other
kinds of legal actions, some of which assert or may assert claims or seek to impose fines and penalties in substantial amounts and are
described below.
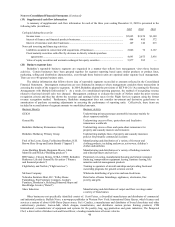
a) Governmental Investigations
In October 2003, General Reinsurance Corporation (“General Reinsurance”), a wholly owned subsidiary of General Re
Corporation (“General Re”) and an indirectly wholly owned subsidiary of Berkshire, and four of its current and former employees,
including its former president, received subpoenas for documents from the U.S. Attorney for the Eastern District of Virginia,
Richmond Division (the “EDVA U.S. Attorney”) in connection with the EDVA U.S. Attorney’ s investigation of Reciprocal of
America (“ROA”). ROA was a Virginia-based reciprocal insurer of physician, hospital and lawyer professional liability risks.