Berkshire Hathaway 2005 Annual Report Download - page 48
Download and view the complete annual report
Please find page 48 of the 2005 Berkshire Hathaway annual report below. You can navigate through the pages in the report by either clicking on the pages listed below, or by using the keyword search tool below to find specific information within the annual report.-
 1
1 -
2
-
3
-
4
-
5
-
6
-
7
-
8
-
9
-
10
-
11
-
12
-
13
-
14
-
15
-
16
-
17
-
18
-
19
-
20
-
21
-
22
-
23
-
24
-
25
-
26
-
27
-
28
-
29
-
30
-
31
-
32
-
33
-
34
-
35
-
36
-
37
-
 38
38 -
 39
39 -
 40
40 -
 41
41 -
 42
42 -
 43
43 -
 44
44 -
 45
45 -
 46
46 -
 47
47 -
 48
48 -
 49
49 -
 50
50 -
 51
51 -
 52
52 -
 53
53 -
 54
54 -
 55
55 -
 56
56 -
 57
57 -
 58
58 -
59
-
60
-
61
-
62
-
63
-
64
-
65
-
66
-
67
-
68
-
69
-
70
-
71
-
72
-
73
-
74
-
75
-
76
-
77
-
78
-
79
-
80
-
81
-
82
 |
 |

47
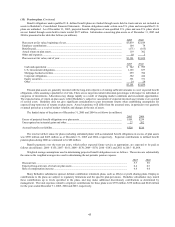
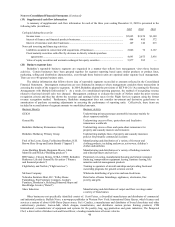
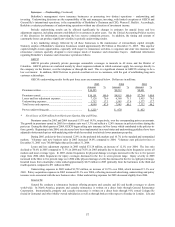
(20) Business segment data (Continued)
A disaggregation of Berkshire’ s consolidated data for each of the three most recent years is presented in the tables which follow
on this and the following page. Amounts are in millions.
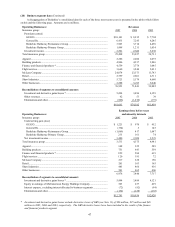
Operating Businesses: Revenues
Insurance group: 2005 2004 2003
Premiums earned:
GEICO ................................................................................................................ $10,101 $ 8,915 $ 7,784
General Re .......................................................................................................... 6,435 7,245 8,245
Berkshire Hathaway Reinsurance Group ............................................................ 3,963 3,714 4,430
Berkshire Hathaway Primary Group................................................................... 1,498 1,211 1,034
Investment income ................................................................................................. 3,501 2,842 3,238
Total insurance group................................................................................................ 25,498 23,927 24,731
Apparel...................................................................................................................... 2,286 2,200 2,075
Building products...................................................................................................... 4,806 4,337 3,846
Finance and financial products *............................................................................... 4,559 3,774 3,045
Flight services ........................................................................................................... 3,660 3,244 2,431
McLane Company..................................................................................................... 24,074 23,373 13,743
Retail......................................................................................................................... 2,759 2,601 2,311
Shaw Industries ......................................................................................................... 5,723 5,174 4,660
Other businesses........................................................................................................ 3,588 3,213 3,040
76,953 71,843 59,882
Reconciliation of segments to consolidated amount:
Investment and derivative gains/losses * ............................................................... 5,494 3,496 4,129
Other revenues ....................................................................................................... 42 53 39
Eliminations and other ........................................................................................... (826) (1,010) (191)
$81,663 $74,382 $63,859
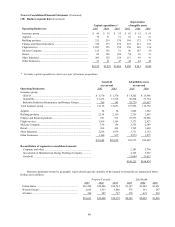
Earnings (loss) before taxes
Operating Businesses: and minority interests
Insurance group: 2005 2004 2003
Underwriting gain (loss):
GEICO ................................................................................................................ $ 1,221 $ 970 $ 452
General Re .......................................................................................................... (334) 3 145
Berkshire Hathaway Reinsurance Group ............................................................ (1,069) 417 1,047
Berkshire Hathaway Primary Group................................................................... 235 161 74
Net investment income........................................................................................... 3,480 2,824 3,223
Total insurance group................................................................................................ 3,533 4,375 4,941
Apparel...................................................................................................................... 348 325 289
Building products...................................................................................................... 751 643 559
Finance and financial products *............................................................................... 822 584 619
Flight services ........................................................................................................... 120 191 72
McLane Company..................................................................................................... 217 228 150
Retail......................................................................................................................... 201 163 165
Shaw Industries ......................................................................................................... 485 466 436
Other businesses........................................................................................................ 501 465 486
6,978 7,440 7,717
Reconciliation of segments to consolidated amount:
Investment and derivative gains/losses * ............................................................... 5,494 3,489 4,121
Equity in earnings of MidAmerican Energy Holdings Company........................... 523 237 429
Interest expense, excluding interest allocated to business segments ...................... (72) (92) (94)
Eliminations and other ........................................................................................... (132) (138) (153)
$12,791 $10,936 $12,020
* Investment and derivative gains/losses exclude derivative losses of GRS (see Note 11) of $86 million, $25 million and $46
million in 2005, 2004 and 2003, respectively. The GRS derivative losses have been included in the results of the finance
and financial products segment.