Berkshire Hathaway 2005 Annual Report Download - page 29
Download and view the complete annual report
Please find page 29 of the 2005 Berkshire Hathaway annual report below. You can navigate through the pages in the report by either clicking on the pages listed below, or by using the keyword search tool below to find specific information within the annual report.-
 1
1 -
2
-
3
-
4
-
5
-
6
-
7
-
8
-
9
-
10
-
11
-
12
-
13
-
14
-
15
-
16
-
17
-
18
-
 19
19 -
 20
20 -
 21
21 -
 22
22 -
 23
23 -
 24
24 -
 25
25 -
 26
26 -
 27
27 -
 28
28 -
 29
29 -
 30
30 -
 31
31 -
 32
32 -
 33
33 -
 34
34 -
 35
35 -
 36
36 -
 37
37 -
 38
38 -
 39
39 -
40
-
41
-
42
-
43
-
44
-
45
-
46
-
47
-
48
-
49
-
50
-
51
-
52
-
53
-
54
-
55
-
56
-
57
-
58
-
59
-
60
-
61
-
62
-
63
-
64
-
65
-
66
-
67
-
68
-
69
-
70
-
71
-
72
-
73
-
74
-
75
-
76
-
77
-
78
-
79
-
80
-
81
-
82
 |
 |

28
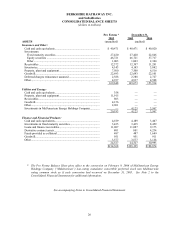
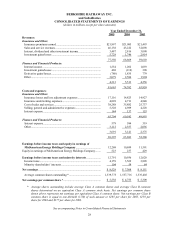
BERKSHIRE HATHAWAY INC.
and Subsidiaries
CONSOLIDATED STATEMENTS OF EARNINGS
(dollars in millions except per share amounts)
Year Ended December 31,
2005 2004 2003
Revenues:
Insurance and Other:
Insurance premiums earned.............................................................. $21,997 $21,085 $21,493
Sales and service revenues ............................................................... 46,138 43,222 32,098
Interest, dividend and other investment income ............................... 3,487 2,816 3,098
Investment gains/losses .................................................................... 5,728 1,746 2,914
77,350 68,869 59,603
Finance and Financial Products:
Interest income ................................................................................. 1,554 1,202 1,093
Investment gains/losses .................................................................... 468 (110) 390
Derivative gains/losses ..................................................................... (788) 1,835 779
Other................................................................................................. 3,079 2,586 1,994
4,313 5,513 4,256
81,663 74,382 63,859
Costs and expenses:
Insurance and Other:
Insurance losses and loss adjustment expenses ................................ 17,116 14,823 14,927
Insurance underwriting expenses...................................................... 4,828 4,711 4,848
Cost of sales and services................................................................. 38,288 35,882 25,737
Selling, general and administrative expenses ................................... 5,328 4,989 4,228
Interest expense ................................................................................ 144 137 153
65,704 60,542 49,893
Finance and Financial Products:
Interest expense................................................................................ 579 584 319
Other................................................................................................. 3,112 2,557 2,056
3,691 3,141 2,375
69,395 63,683 52,268
Earnings before income taxes and equity in earnings of
MidAmerican Energy Holdings Company................................... 12,268 10,699 11,591
Equity in earnings of MidAmerican Energy Holdings Company........ 523 237 429
Earnings before income taxes and minority interests .................... 12,791 10,936 12,020
Income taxes..................................................................................... 4,159 3,569 3,805
Minority shareholders’ interests ....................................................... 104 59 64
Net earnings ....................................................................................... $ 8,528 $ 7,308 $ 8,151
Average common shares outstanding * ............................................ 1,539,775 1,537,716 1,535,405
Net earnings per common share *.................................................... $ 5,538 $ 4,753 $ 5,309
* Average shares outstanding include average Class A common shares and average Class B common
shares determined on an equivalent Class A common stock basis. Net earnings per common share
shown above represents net earnings per equivalent Class A common share. Net earnings per Class B
common share is equal to one-thirtieth (1/30) of such amount or $185 per share for 2005, $158 per
share for 2004 and $177 per share for 2003.
See accompanying Notes to Consolidated Financial Statements