Berkshire Hathaway 2005 Annual Report Download - page 30
Download and view the complete annual report
Please find page 30 of the 2005 Berkshire Hathaway annual report below. You can navigate through the pages in the report by either clicking on the pages listed below, or by using the keyword search tool below to find specific information within the annual report.-
 1
1 -
2
-
3
-
4
-
5
-
6
-
7
-
8
-
9
-
10
-
11
-
12
-
13
-
14
-
15
-
16
-
17
-
18
-
19
-
 20
20 -
 21
21 -
 22
22 -
 23
23 -
 24
24 -
 25
25 -
 26
26 -
 27
27 -
 28
28 -
 29
29 -
 30
30 -
 31
31 -
 32
32 -
 33
33 -
 34
34 -
 35
35 -
 36
36 -
 37
37 -
 38
38 -
 39
39 -
 40
40 -
41
-
42
-
43
-
44
-
45
-
46
-
47
-
48
-
49
-
50
-
51
-
52
-
53
-
54
-
55
-
56
-
57
-
58
-
59
-
60
-
61
-
62
-
63
-
64
-
65
-
66
-
67
-
68
-
69
-
70
-
71
-
72
-
73
-
74
-
75
-
76
-
77
-
78
-
79
-
80
-
81
-
82
 |
 |

29
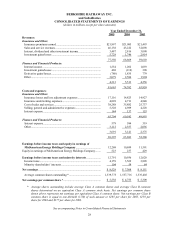
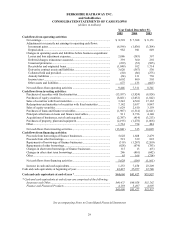
BERKSHIRE HATHAWAY INC.
and Subsidiaries
CONSOLIDATED STATEMENTS OF CASH FLOWS
(dollars in millions)
Year Ended December 31,
2005 2004 2003
Cash flows from operating activities:
Net earnings................................................................................................ $ 8,528 $ 7,308 $ 8,151
Adjustments to reconcile net earnings to operating cash flows:
Investment gains ...................................................................................... (6,196) (1,636) (3,304)
Depreciation............................................................................................. 982 941 849
Changes in operating assets and liabilities before business acquisitions:
Losses and loss adjustment expenses....................................................... 2,086 (383) 397
Deferred charges reinsurance assumed .................................................... 339 360 292
Unearned premiums................................................................................. (239) (52) (585)
Receivables and originated loans............................................................. (1,849) 102 1,714
Derivative contract assets and liabilities.................................................. 3,620 (367) 530
Collateral held and provided.................................................................... (80) (86) (273)
Annuity liabilities .................................................................................... (24) 131 730
Income taxes ............................................................................................ 1,602 860 505
Other assets and liabilities ....................................................................... 677 133 (665)
Net cash flows from operating activities .................................................... 9,446 7,311 8,341
Cash flows from investing activities:
Purchases of securities with fixed maturities.............................................. (13,937) (5,924) (9,924)
Purchases of equity securities..................................................................... (8,021) (2,032) (1,842)
Sales of securities with fixed maturities ..................................................... 3,243 4,560 17,165
Redemptions and maturities of securities with fixed maturities ................. 7,142 5,637 9,847
Sales of equity securities ............................................................................ 1,629 2,610 3,159
Purchases of loans and finance receivables ................................................ (1,987) (6,314) (2,641)
Principal collections on loans and finance receivables............................... 911 2,736 4,140
Acquisitions of businesses, net of cash acquired........................................ (2,387) (414) (3,213)
Purchases of property, plant and equipment............................................... (2,195) (1,278) (1,066)
Other........................................................................................................... 1,761 734 404
Net cash flows from investing activities..................................................... (13,841) 315 16,029
Cash flows from financing activities:
Proceeds from borrowings of finance businesses....................................... 5,628 1,668 2,479
Proceeds from other borrowings................................................................. 521 339 822
Repayments of borrowings of finance businesses ...................................... (319) (1,267) (2,260)
Repayments of other borrowings................................................................ (628) (674) (783)
Changes in short term borrowings of finance businesses ........................... 115 13 (63)
Changes in other short term borrowings..................................................... 246 (401) (642)
Other........................................................................................................... 65 166 (714)
Net cash flows from financing activities .................................................... 5,628 (156) (1,161)
Increase in cash and cash equivalents......................................................... 1,233 7,470 23,209
Cash and cash equivalents at beginning of year............................................... 43,427 35,957 12,748
Cash and cash equivalents at end of year *.................................................. $44,660 $43,427 $35,957
* Cash and cash equivalents at end of year are comprised of the following:
Insurance and Other................................................................................... $40,471 $40,020 $31,262
Finance and Financial Products ................................................................ 4,189 3,407 4,695
$44,660 $43,427 $35,957
See accompanying Notes to Consolidated Financial Statements