Berkshire Hathaway 2005 Annual Report Download - page 4
Download and view the complete annual report
Please find page 4 of the 2005 Berkshire Hathaway annual report below. You can navigate through the pages in the report by either clicking on the pages listed below, or by using the keyword search tool below to find specific information within the annual report.-
 1
1 -
 2
2 -
 3
3 -
 4
4 -
 5
5 -
 6
6 -
 7
7 -
 8
8 -
 9
9 -
 10
10 -
 11
11 -
 12
12 -
 13
13 -
 14
14 -
 15
15 -
16
-
17
-
18
-
19
-
20
-
21
-
22
-
23
-
24
-
25
-
26
-
27
-
28
-
29
-
30
-
31
-
32
-
33
-
34
-
35
-
36
-
37
-
38
-
39
-
40
-
41
-
42
-
43
-
44
-
45
-
46
-
47
-
48
-
49
-
50
-
51
-
52
-
53
-
54
-
55
-
56
-
57
-
58
-
59
-
60
-
61
-
62
-
63
-
64
-
65
-
66
-
67
-
68
-
69
-
70
-
71
-
72
-
73
-
74
-
75
-
76
-
77
-
78
-
79
-
80
-
81
-
82
 |
 |

BERKSHIRE HATHAWAY INC.
To the Shareholders of Berkshire Hathaway Inc.:
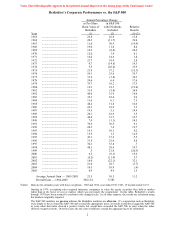
Our gain in net worth during 2005 was $5.6 billion, which increased the per-share book value of
both our Class A and Class B stock by 6.4%. Over the last 41 years (that is, since present management
took over) book value has grown from $19 to $59,377, a rate of 21.5% compounded annually.*
Berkshire had a decent year in 2005. We initiated five acquisitions (two of which have yet to
close) and most of our operating subsidiaries prospered. Even our insurance business in its entirety did
well, though Hurricane Katrina inflicted record losses on both Berkshire and the industry. We estimate our
loss from Katrina at $2.5 billion – and her ugly sisters, Rita and Wilma, cost us an additional $.9 billion.
Credit GEICO – and its brilliant CEO, Tony Nicely – for our stellar insurance results in a disaster-
ridden year. One statistic stands out: In just two years, GEICO improved its productivity by 32%.
Remarkably, employment fell by 4% even as policy count grew by 26% – and more gains are in store.
When we drive unit costs down in such a dramatic manner, we can offer ever-greater value to our
customers. The payoff: Last year, GEICO gained market-share, earned commendable profits and
strengthened its brand. If you have a new son or grandson in 2006, name him Tony.
* * * * * * * * * * * *
My goal in writing this report is to give you the information you need to estimate Berkshire’ s
intrinsic value. I say “estimate” because calculations of intrinsic value, though all-important, are
necessarily imprecise and often seriously wrong. The more uncertain the future of a business, the more
possibility there is that the calculation will be wildly off-base. (For an explanation of intrinsic value, see
pages 77 – 78.) Here Berkshire has some advantages: a wide variety of relatively-stable earnings streams,
combined with great liquidity and minimum debt. These factors mean that Berkshire’ s intrinsic value can
be more precisely calculated than can the intrinsic value of most companies.
Yet if precision is aided by Berkshire’ s financial characteristics, the job of calculating intrinsic
value has been made more complex by the mere presence of so many earnings streams. Back in 1965,
when we owned only a small textile operation, the task of calculating intrinsic value was a snap. Now we
own 68 distinct businesses with widely disparate operating and financial characteristics. This array of
unrelated enterprises, coupled with our massive investment holdings, makes it impossible for you to simply
examine our consolidated financial statements and arrive at an informed estimate of intrinsic value.
We have attempted to ease this problem by clustering our businesses into four logical groups, each
of which we discuss later in this report. In these discussions, we will provide the key figures for both the
group and its important components. Of course, the value of Berkshire may be either greater or less than
the sum of these four parts. The outcome depends on whether our many units function better or worse by
being part of a larger enterprise and whether capital allocation improves or deteriorates when it is under the
direction of a holding company. In other words, does Berkshire ownership bring anything to the party, or
would our shareholders be better off if they directly owned shares in each of our 68 businesses? These are
important questions but ones that you will have to answer for yourself.
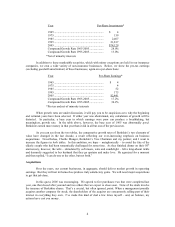
Before we look at our individual businesses, however, let’ s review two sets of figures that show
where we’ ve come from and where we are now. The first set is the amount of investments (including cash
and cash-equivalents) we own on a per-share basis. In making this calculation, we exclude investments
held in our finance operation because these are largely offset by borrowings:
*All figures used in this report apply to Berkshire’ s A shares, the successor to the only stock that
the company had outstanding before 1996. The B shares have an economic interest equal to 1/30th that of
the A.
3