Berkshire Hathaway 2005 Annual Report Download - page 63
Download and view the complete annual report
Please find page 63 of the 2005 Berkshire Hathaway annual report below. You can navigate through the pages in the report by either clicking on the pages listed below, or by using the keyword search tool below to find specific information within the annual report.-
 1
1 -
2
-
3
-
4
-
5
-
6
-
7
-
8
-
9
-
10
-
11
-
12
-
13
-
14
-
15
-
16
-
17
-
18
-
19
-
20
-
21
-
22
-
23
-
24
-
25
-
26
-
27
-
28
-
29
-
30
-
31
-
32
-
33
-
34
-
35
-
36
-
37
-
38
-
39
-
40
-
41
-
42
-
43
-
44
-
45
-
46
-
47
-
48
-
49
-
50
-
51
-
52
-
 53
53 -
 54
54 -
 55
55 -
 56
56 -
 57
57 -
 58
58 -
 59
59 -
 60
60 -
 61
61 -
 62
62 -
 63
63 -
 64
64 -
 65
65 -
 66
66 -
 67
67 -
 68
68 -
 69
69 -
 70
70 -
 71
71 -
 72
72 -
 73
73 -
74
-
75
-
76
-
77
-
78
-
79
-
80
-
81
-
82
 |
 |

62
Management’s Discussion (Continued)
Non-Insurance Businesses (Continued)
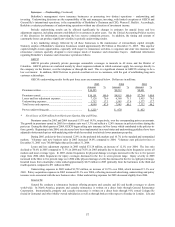
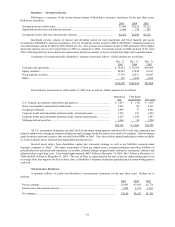
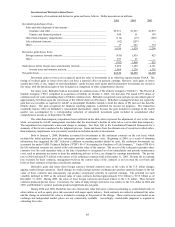
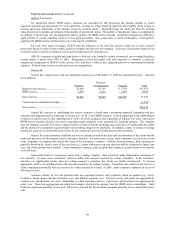
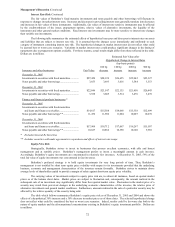
A comparison of revenues and pre-tax earnings between 2005, 2004 and 2003 for the non-insurance businesses
follows. Dollars are in millions.
Revenues Pre-tax earnings
2005 2004 2003 2005 2004 2003
Apparel........................................................................... $ 2,286 $ 2,200 $ 2,075 $ 348 $ 325 $ 289
Building products........................................................... 4,806 4,337 3,846 751 643 559
Finance and financial products....................................... 4,559 3,774 3,045 822 584 619
Flight services * ............................................................. 3,660 3,244 2,431 120 191 72
McLane Company.......................................................... 24,074 23,373 13,743 217 228 150
Retail.............................................................................. 2,759 2,601 2,311 201 163 165
Shaw Industries .............................................................. 5,723 5,174 4,660 485 466 436
Other businesses............................................................. 3,588 3,213 3,040 501 465 486
$51,455 $47,916 $35,151 $3,445 $3,065 $2,776
* In 2004, Berkshire adopted the provisions of EITF 00-21 (“Accounting for Revenue Arrangements with Multiple
Deliverables”). As a result, for consolidated reporting purposes, the method of recognizing revenue related to NetJets’
fractional aircraft sales was changed. Management continues to evaluate the results of NetJets under the prior revenue
recognition criteria and thus has shown revenues and pre-tax earnings for the flight services segment using the prior revenue
recognition method. Revenues shown in this table are greater than the amounts reported in Berkshire’s consolidated financial
statements by $704 million in 2005 and $902 million in 2004. Pre-tax earnings included in this table for 2005 and 2004 exceed
the amounts included in the consolidated financial statements by $63 million and $74 million, respectively.
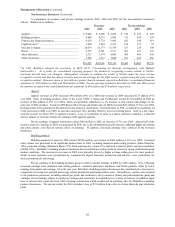
Apparel
Apparel revenues in 2005 increased $86 million (4%) over 2004 and revenues in 2004 increased $125 million (6%)
over 2003. Sales of clothing products (Fruit of the Loom (“FOL”), Garan and Fechheimer) totaled $1,754 million in 2005 an
increase of $60 million (3.5%) over 2004, which was primarily attributed to a 3% increase in unit volume and changes in the
sales mix of FOL products. Footwear (HH Brown Shoe Group and Justin) sales in 2005 increased $26 million (5.3%) over 2004.
Increased sales were generated in Western boots and women’ s casual shoes. Increased sales by FOL accounted for essentially all
of the increases in 2004 over 2003, as unit sales increased 14%, partially offset by lower net selling prices. Sales to a few major
retailers account for about 45% of apparel revenues. Loss or curtailment of sales to a major customer could have a material
adverse impact on revenues and pre-tax earnings of the apparel segment.
Pre-tax earnings of apparel businesses totaled $348 million in 2005, an increase of 7% over 2004. Almost half of the
increase in pre-tax earnings in 2005 was generated by FOL due to the aforementioned sales increase, although higher advertising
and plant closure costs had an adverse effect on earnings. In addition, increased earnings were achieved in the footwear
businesses.
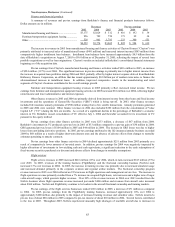
Building products
Building products revenues in 2005 totaled $4,806 million, an increase of $469 million (11%) over 2004. Increased
sales volume was generated in all significant product lines in 2005, including insulation and roofing products (Johns Manville-
10%), paint and coatings (Benjamin Moore-5%), brick and masonry (Acme-11%) and steel connector plates and truss machinery
(MiTek-22%). Berkshire’ s building products businesses have benefited in recent periods by relatively strong residential housing
market conditions. The increases in revenues in 2005 were primarily driven by higher average selling prices for most products,
which in most instances were precipitated by comparatively higher materials, production and delivery costs, particularly for
steel, petrochemicals and energy.
Pre-tax earnings of the building products group in 2005 exceeded earnings in 2004 by $108 million (17%), reflecting
increased earnings from insulation and roofing products, connector plate/truss machinery and bricks partially offset by lower
earnings from paints and coatings. Over the past year, Berkshire’ s building products businesses have instituted price increases to
compensate for rising raw material and energy related production and transportation costs. Nevertheless, certain costs essential
to the production processes, including natural gas (brick and insulation), steel (connector plates) and petrochemicals (paint and
coatings) are increasingly subject to rapid price changes and constraints in availability for a variety of reasons. In addition, rapid
rises in interest rates could adversely affect housing construction which could result in declining sales for Berkshire’ s building
products businesses. The pre-tax results for 2003 included a loss of $21 million from a fire at a Johns Manville pipe insulation
plant.