Berkshire Hathaway 2005 Annual Report Download - page 62
Download and view the complete annual report
Please find page 62 of the 2005 Berkshire Hathaway annual report below. You can navigate through the pages in the report by either clicking on the pages listed below, or by using the keyword search tool below to find specific information within the annual report.-
 1
1 -
2
-
3
-
4
-
5
-
6
-
7
-
8
-
9
-
10
-
11
-
12
-
13
-
14
-
15
-
16
-
17
-
18
-
19
-
20
-
21
-
22
-
23
-
24
-
25
-
26
-
27
-
28
-
29
-
30
-
31
-
32
-
33
-
34
-
35
-
36
-
37
-
38
-
39
-
40
-
41
-
42
-
43
-
44
-
45
-
46
-
47
-
48
-
49
-
50
-
51
-
 52
52 -
 53
53 -
 54
54 -
 55
55 -
 56
56 -
 57
57 -
 58
58 -
 59
59 -
 60
60 -
 61
61 -
 62
62 -
 63
63 -
 64
64 -
 65
65 -
 66
66 -
 67
67 -
 68
68 -
 69
69 -
 70
70 -
 71
71 -
 72
72 -
73
-
74
-
75
-
76
-
77
-
78
-
79
-
80
-
81
-
82
 |
 |

61
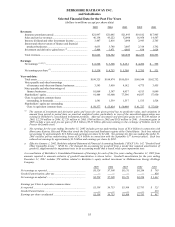
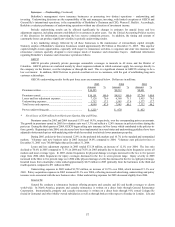
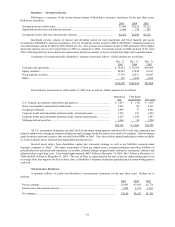
Insurance — Investment Income
Following is a summary of the net investment income of Berkshire’ s insurance operations for the past three years.
Dollars are in millions.
2005 2004 2003
Investment income before taxes........................................................................................ $3,480 $2,824 $3,223
Applicable income taxes and minority interests................................................................ 1,068 779 947
Investment income after taxes and minority interests ....................................................... $2,412 $2,045 $2,276
Investment income consists of interest and dividends earned on cash equivalents and fixed maturity and equity
investments of Berkshire’ s insurance businesses. Pre-tax investment income earned in 2005 by Berkshire’ s insurance businesses
exceeded amounts earned in 2004 by $656 million (23.2%). The increase in investment income in 2005 primarily reflects higher
short-term interest rates in the United States in 2005 as compared to 2004. Investment income in 2004 declined 12.4% from
2003, reflecting relatively lower short-term interest rates and lower amounts of interest earned from high yield corporate bonds.
A summary of investments held in Berkshire’ s insurance businesses follows. Dollar amounts are in millions.
Dec. 31,
2005
Dec. 31,
2004
Dec. 31,
2003
Cash and cash equivalents............................................................................................... $ 38,814 $ 38,706 $29,908
Equity securities .............................................................................................................. 46,412 37,420 35,017
Fixed maturity securities ................................................................................................. 27,385 22,831 26,087
Other................................................................................................................................ 918 2,059 2,656
$113,529 $101,016 $93,668
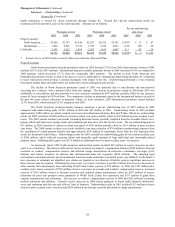
Fixed maturity investments as of December 31, 2005 were as follows. Dollar amounts are in millions.
Amortized
cost
Unrealized
gains/losses
Fair value
U.S. Treasury, government corporations and agencies ................................................. $ 7,633 $ (15) $ 7,618
States, municipalities and political subdivisions ........................................................... 4,243 90 4,333
Foreign governments..................................................................................................... 6,884 77 6,961
Corporate bonds and redeemable preferred stocks, investment grade........................... 3,235 187 3,422
Corporate bonds and redeemable preferred stocks, non-investment grade.................... 2,257 1,290 3,547
Mortgage-backed securities........................................................................................... 1,464 40 1,504
$25,716 $ 1,669 $27,385
All U.S. government obligations are rated AAA by the major rating agencies and about 95% of all state, municipal and
political subdivisions, foreign government obligations and mortgage-backed securities were rated AA or higher. Non-investment
grade securities represent securities that are rated below BBB- or Baa3. Fair value reflects quoted market prices where available
or, if not available, prices obtained from independent pricing services.
Invested assets derive from shareholder capital and reinvested earnings as well as net liabilities assumed under
insurance contracts or “float.” The major components of float are unpaid losses, unearned premiums and other liabilities to
policyholders less premiums and reinsurance receivables, deferred charges assumed under retroactive reinsurance contracts and
deferred policy acquisition costs. Float totaled approximately $49.3 billion at December 31, 2005, $46.1 billion at December 31,
2004 and $44.2 billion at December 31, 2003. The cost of float, as represented by the ratio of pre-tax underwriting gain or loss
to average float, was negative for the last three years, as Berkshire’ s insurance businesses generated pre-tax underwriting gains in
each year.
Non-Insurance Businesses
A summary follows of results from Berkshire’ s non-insurance businesses for the past three years. Dollars are in
millions.
2005 2004 2003
Pre-tax earnings .................................................................................................................... $3,445 $3,065 $2,776
Income taxes and minority interests...................................................................................... 1,285 1,152 1,031
Net earnings .......................................................................................................................... $2,160 $1,913 $1,745