BP 2012 Annual Report Download - page 92
Download and view the complete annual report
Please find page 92 of the 2012 BP annual report below. You can navigate through the pages in the report by either clicking on the pages listed below, or by using the keyword search tool below to find specific information within the annual report.-
 1
1 -
2
-
3
-
4
-
5
-
6
-
7
-
8
-
9
-
10
-
11
-
12
-
13
-
14
-
15
-
16
-
17
-
18
-
19
-
20
-
21
-
22
-
23
-
24
-
25
-
26
-
27
-
28
-
29
-
30
-
31
-
32
-
33
-
34
-
35
-
36
-
37
-
38
-
39
-
40
-
41
-
42
-
43
-
44
-
45
-
46
-
47
-
48
-
49
-
50
-
51
-
52
-
53
-
54
-
55
-
56
-
57
-
58
-
59
-
60
-
61
-
62
-
63
-
64
-
65
-
66
-
67
-
68
-
69
-
70
-
71
-
72
-
73
-
74
-
75
-
76
-
77
-
78
-
79
-
80
-
81
-
 82
82 -
 83
83 -
 84
84 -
 85
85 -
 86
86 -
 87
87 -
 88
88 -
 89
89 -
 90
90 -
 91
91 -
 92
92 -
 93
93 -
 94
94 -
 95
95 -
 96
96 -
 97
97 -
 98
98 -
 99
99 -
 100
100 -
 101
101 -
 102
102 -
103
-
104
-
105
-
106
-
107
-
108
-
109
-
110
-
111
-
112
-
113
-
114
-
115
-
116
-
117
-
118
-
119
-
120
-
121
-
122
-
123
-
124
-
125
-
126
-
127
-
128
-
129
-
130
-
131
-
132
-
133
-
134
-
135
-
136
-
137
-
138
-
139
-
140
-
141
-
142
-
143
-
144
-
145
-
146
-
147
-
148
-
149
-
150
-
151
-
152
-
153
-
154
-
155
-
156
-
157
-
158
-
159
-
160
-
161
-
162
-
163
-
164
-
165
-
166
-
167
-
168
-
169
-
170
-
171
-
172
-
173
-
174
-
175
-
176
-
177
-
178
-
179
-
180
-
181
-
182
-
183
-
184
-
185
-
186
-
187
-
188
-
189
-
190
-
191
-
192
-
193
-
194
-
195
-
196
-
197
-
198
-
199
-
200
-
201
-
202
-
203
-
204
-
205
-
206
-
207
-
208
-
209
-
210
-
211
-
212
-
213
-
214
-
215
-
216
-
217
-
218
-
219
-
220
-
221
-
222
-
223
-
224
-
225
-
226
-
227
-
228
-
229
-
230
-
231
-
232
-
233
-
234
-
235
-
236
-
237
-
238
-
239
-
240
-
241
-
242
-
243
-
244
-
245
-
246
-
247
-
248
-
249
-
250
-
251
-
252
-
253
-
254
-
255
-
256
-
257
-
258
-
259
-
260
-
261
-
262
-
263
-
264
-
265
-
266
-
267
-
268
-
269
-
270
-
271
-
272
-
273
-
274
-
275
-
276
-
277
-
278
-
279
-
280
-
281
-
282
-
283
-
284
-
285
-
286
-
287
-
288
-
289
-
290
-
291
-
292
-
293
-
294
-
295
-
296
-
297
-
298
-
299
-
300
-
301
-
302
-
303
 |
 |

Business review: BP in more depth
BP Annual Report and Form 20-F 2012
90
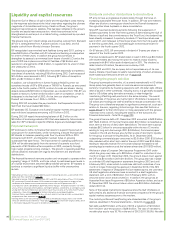
Liquidity and capital resources
Since the Gulf of Mexico oil spill in 2010 and the significant costs relating
to the response activities and the initial uncertainty regarding the ultimate
magnitude of its liabilities and timing of cash outflows, the group’s
situation has continued to stabilize. This has been reflected in the group’s
liquidity and capital resources position, which has continued to be
strengthened as well as put on a stable footing, underpinned by a prudent
financial framework.
The group’s long-term credit ratings are A (positive outlook) from Standard
& Poor’s, strengthened from A (stable outlook) in July 2012, and A2
(stable outlook) from Moody’s Investor Services.
BP renegotiated its committed bank facilities during early 2011, putting in
place $6.8 billion of facilities with 23 international banking counterparties
for a term of three years. In addition the group has continued to
strengthen its access to commercial bank letters of credit (LC) and at the
end of 2012 has in place committed LC facilities of $6.9 billion and
secured LC arrangements of $2.2 billion, to supplement its uncommitted
and unsecured LC lines.
The disposal programme for $38 billion has been essentially completed a
year ahead of schedule, including $15 billion during 2012. Cash receipts of
$11.4 billion were received in 2012, following $2.7 billion of receipts in
2011 and $17.0 billion in 2010.
In addition, we will benefit from further financial flexibility when we
complete the sale of BP’s 50% share in TNK-BP to Rosneft, as announced
early in the fourth quarter of 2012, in return for cash and shares. Having
already received $709 million in December as a dividend from TNK-BP, we
expect to receive a further net $11.6 billion cash on completion, which is
anticipated in the first half of 2013. At that time our shareholding in
Rosneft will increase from 1.25% to 19.75%.
During 2012 BP completed the payments into the Deepwater Horizon Oil
Spill Trust that have totalled $20 billion.
BP accessed US, European and Australian capital markets throughout the
year with bond issuances amounting to $11 billion in 2012.
During 2012 BP repaid the remaining balance of $2.3 billion on the
$4.5 billion of borrowings raised in 2010 that were backed by future crude oil
sales from BP’s interests in specific offshore Angola and Azerbaijan fields.
Financial framework
BP continues to refine its financial framework to support the pursuit of
value growth for shareholders, while maintaining a secure financial base.
BP intends to increase operating cash flowa by around 50% in 2014
compared with 2011b, and thereafter maintain focus on growing
sustainable free cash flowsc. The improvement in operating cashflow to
2014 will be delivered partly from the removal of quarterly trust fund
payments of $1.25 billion after completion in 2012, and partly through
high-margin projects coming onstream. The growth in operating cashflow
will be utilized to increase both organic reinvestment and shareholder
distributions.
The financial framework remains prudent and we expect to operate within
a gearingd range of 10-20%, and to be robust to cash break-even levels in
an oil price environment between $80 and $100 per barrel. BP expects to
continue to maintain a significant liquidity buffer while uncertainties
remain.
a
Operating cash flow is net cash provided by (used in) operating activities, as presented in the
group cash flow statement on page 185.
b Adjusted to remove TNK-BP dividends from 2011 and 2014 operating cash flow; 2014 includes
BP’s estimate of Rosneft dividend; 2014 includes the impact of payments in respect of the
settlement of all federal criminal and securities claims with the US government; BP’s
assumption for 2014 is $100/bbl oil, $5/mmBtu Henry Hub gas. The projection does not reflect
any cash flows relating to other liabilities, contingent liabilities, settlements or contingent assets
arising from the Gulf of Mexico oil spill, which may or may not arise at that time. See Financial
statements – Note 43 on page 253 for further information on contingent liabilities.
c
Free cash flow is operating cash flow less net cash used in investing activities, as presented in
the group cash flow statement on page 185.
d Gearing refers to the ratio of the group’s net debt to net debt plus equity and is a non-GAAP
measure. See Financial statements – Note 35 on page 234 for information on gross debt, which
is the nearest equivalent measure to net debt on an IFRS basis.
Dividends and other distributions to shareholders
BP aims to have a progressive dividend policy through the focus on
increasing sustainable free cash flows. In addition, BP has committed to
offset any dilution to earnings per share from the Rosneft transaction
through either share buybacks or share consolidation.
Since BP resumed dividend payments following the suspension of
dividend payments for the first three quarters of 2010 relating the Gulf of
Mexico oil spill and the commitments to the Trust Fund, the dividend has
been steadily increased. A quarterly dividend of 7 cents per share was
paid in 2011, and increased to 8 cents per share from the first quarter 2012
to the third quarter 2012, and increased again to 9 cents per share for
payment in the fourth quarter 2012.
On 5 February 2013, BP announced a dividend of 9 cents per share in
respect of the fourth quarter 2012.
The total dividend paid to BP shareholders in cash in 2012 was $5.3 billion
with shareholders also having the option to receive a scrip dividend,
compared with $4.1 billion cash dividend paid in 2011. The dividend is
determined in US dollars, the economic currency of BP.
During 2012 and 2011, the company did not repurchase any of its own
shares. Details of purchases to satisfy requirements of certain employee
share-based payment plans are set out on page 158.
Financing the group’s activities
The group’s principal commodity, oil, is priced internationally in US dollars.
Group policy has generally been to minimize economic exposure to
currency movements by financing operations with US dollar debt. Where
debt is issued in other currencies, including euros, it is generally swapped
back to US dollars using derivative contracts, or else hedged by
maintaining offsetting cash positions in the same currency. The overall
cash balances of the group are mainly held in US dollars or swapped to
US dollars and holdings are well-diversified to reduce concentration risk.
The group is not therefore exposed to significant currency risk, such as in
relation to the euro, regarding its borrowings. Also see Risk factors on
pages 38-44 for further information on risks associated with the general
macroeconomic outlook, including the stability of the eurozone and
Financial statements – Note 26 on page 220.
The group’s finance debt at 31 December 2012 amounted to $48.8 billion
(2011 $44.2 billion). Of the total finance debt, $10.0 billion is classified as
short term at the end of 2012 (2011 $9.0 billion). The short-term balance
includes $6.2 billion for amounts repayable within the next 12 months
relating to long-term borrowings (2011 $4.9 billion). Commercial paper
markets in the US and Europe are a further source of short-term liquidity
for the group to provide timing flexibility. At 31 December 2012,
outstanding commercial paper amounted to $3.0 billion (2011 $3.6 billion).
Also included within short-term debt at the end of 2012 was $0.6 billion
relating to deposits received for announced disposal transactions still
pending legal completion post the balance sheet date (2011 $30 million).
We have in place a European Debt Issuance Programme (DIP) under
which the group may raise up to $20 billion of debt for maturities of one
month or longer. At 31 December 2012, the amount drawn down against
the DIP was $14.0 billion (2011 $11.6 billion). The group also had in place
an unlimited US shelf registration statement throughout 2012 and until
5 February 2013, under which it could raise debt with maturities of one
month or longer. Following the approval in December 2012 of the SEC
settlement in respect of Deepwater Horizon-related claims, the unlimited
US shelf registration statement was converted to a shelf registration
statement with a limit of $30 billion from 5 February 2013, with no
amounts drawn down since conversion. In addition, the group has an
Australian Note Issue Programme of $5 billion Australian dollars, and as at
31 December 2012 the amount drawn down was $0.5 billion Australian
dollars (2011 nil).
None of the capital market bond issuances since the Gulf of Mexico oil
spill contains any additional financial covenants compared with the group’s
capital markets issuances prior to the incident.
The maturity profile and fixed/floating rate characteristics of the group’s
debt are described in Financial statements – Note 34 on page 233.
Net debt was $27.5 billion at the end of 2012, a reduction of $1.5 billion
from the 2011 year-end position of $29.0 billion. The ratio of net debt to
net debt plus equity was 18.7% at the end of 2012 (2011 20.5%). Net debt