BP 2012 Annual Report Download - page 213
Download and view the complete annual report
Please find page 213 of the 2012 BP annual report below. You can navigate through the pages in the report by either clicking on the pages listed below, or by using the keyword search tool below to find specific information within the annual report.-
 1
1 -
2
-
3
-
4
-
5
-
6
-
7
-
8
-
9
-
10
-
11
-
12
-
13
-
14
-
15
-
16
-
17
-
18
-
19
-
20
-
21
-
22
-
23
-
24
-
25
-
26
-
27
-
28
-
29
-
30
-
31
-
32
-
33
-
34
-
35
-
36
-
37
-
38
-
39
-
40
-
41
-
42
-
43
-
44
-
45
-
46
-
47
-
48
-
49
-
50
-
51
-
52
-
53
-
54
-
55
-
56
-
57
-
58
-
59
-
60
-
61
-
62
-
63
-
64
-
65
-
66
-
67
-
68
-
69
-
70
-
71
-
72
-
73
-
74
-
75
-
76
-
77
-
78
-
79
-
80
-
81
-
82
-
83
-
84
-
85
-
86
-
87
-
88
-
89
-
90
-
91
-
92
-
93
-
94
-
95
-
96
-
97
-
98
-
99
-
100
-
101
-
102
-
103
-
104
-
105
-
106
-
107
-
108
-
109
-
110
-
111
-
112
-
113
-
114
-
115
-
116
-
117
-
118
-
119
-
120
-
121
-
122
-
123
-
124
-
125
-
126
-
127
-
128
-
129
-
130
-
131
-
132
-
133
-
134
-
135
-
136
-
137
-
138
-
139
-
140
-
141
-
142
-
143
-
144
-
145
-
146
-
147
-
148
-
149
-
150
-
151
-
152
-
153
-
154
-
155
-
156
-
157
-
158
-
159
-
160
-
161
-
162
-
163
-
164
-
165
-
166
-
167
-
168
-
169
-
170
-
171
-
172
-
173
-
174
-
175
-
176
-
177
-
178
-
179
-
180
-
181
-
182
-
183
-
184
-
185
-
186
-
187
-
188
-
189
-
190
-
191
-
192
-
193
-
194
-
195
-
196
-
197
-
198
-
199
-
200
-
201
-
202
-
 203
203 -
 204
204 -
 205
205 -
 206
206 -
 207
207 -
 208
208 -
 209
209 -
 210
210 -
 211
211 -
 212
212 -
 213
213 -
 214
214 -
 215
215 -
 216
216 -
 217
217 -
 218
218 -
 219
219 -
 220
220 -
 221
221 -
 222
222 -
 223
223 -
224
-
225
-
226
-
227
-
228
-
229
-
230
-
231
-
232
-
233
-
234
-
235
-
236
-
237
-
238
-
239
-
240
-
241
-
242
-
243
-
244
-
245
-
246
-
247
-
248
-
249
-
250
-
251
-
252
-
253
-
254
-
255
-
256
-
257
-
258
-
259
-
260
-
261
-
262
-
263
-
264
-
265
-
266
-
267
-
268
-
269
-
270
-
271
-
272
-
273
-
274
-
275
-
276
-
277
-
278
-
279
-
280
-
281
-
282
-
283
-
284
-
285
-
286
-
287
-
288
-
289
-
290
-
291
-
292
-
293
-
294
-
295
-
296
-
297
-
298
-
299
-
300
-
301
-
302
-
303
 |
 |

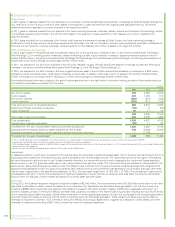
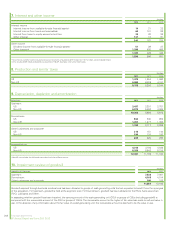
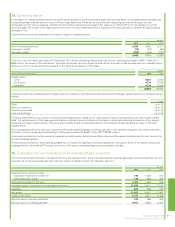
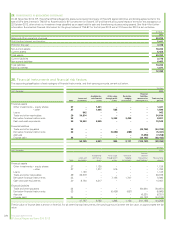
14. Operating leases
In the case of an operating lease entered into by BP as the operator of a jointly controlled asset, the amounts shown in the tables below represent the
net operating lease expense and net future minimum lease payments. These net amounts are after deducting amounts reimbursed, or to be
reimbursed, by joint venture partners, whether the joint venture partners have co-signed the lease or not. Where BP is not the operator of a jointly
controlled asset, BP’s share of the lease expense and future minimum lease payments is included in the amounts shown, whether BP has co-signed
the lease or not.
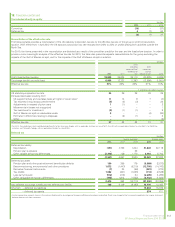
The table below shows the expense for the year in respect of operating leases.
$ million
2012 2011 2010
Minimum lease payments 5,255 4,866 5,371
Contingent rentals (79) (97) (60)
Sub-lease rentals (228) (153) (121)
4,948 4,616 5,190
The future minimum lease payments at 31 December 2012, before deducting related rental income from operating sub-leases of $271 million (2011
$566 million), are shown in the table below. This does not include future contingent rentals. Where the lease rentals are dependent on a variable factor,
the future minimum lease payments are based on the factor as at inception of the lease.
$ million
Future minimum lease payments 2012 2011
Payable within
1 year 4,531 4,182
2 to 5 years 9,733 8,346
Thereafter 4,195 3,544
18,459 16,072
The group enters into operating leases of ships, plant and machinery, commercial vehicles and land and buildings. Typical durations of the leases are as
follows:
Years
Ships up to 15
Plant and machinery up to 10
Commercial vehicles up to 15
Land and buildings up to 40
The group has entered into a number of structured operating leases for ships and in most cases the lease rental payments vary with market interest
rates. The variable portion of the lease payments above or below the amount based on the market interest rate prevailing at inception of the lease is
treated as contingent rental expense. The group also routinely enters into bareboat charters, time-charters and spot-charters for ships on standard
industry terms.
The most significant items of plant and machinery hired under operating leases are drilling rigs used in the Upstream segment. At 31 December 2012,
the future minimum lease payments relating to drilling rigs amounted to $8,527 million (2011 $6,292 million).
Commercial vehicles hired under operating leases are primarily railcars. Retail service station sites and office accommodation are the main items inthe
land and buildings category.
The terms and conditions of these operating leases do not impose any significant financial restrictions on the group. Some of the leases of ships and
buildings allow for renewals at BP’s option, and some of the group’s operating leases contain escalation clauses.
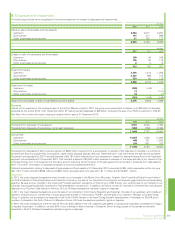
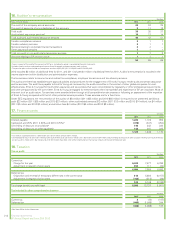
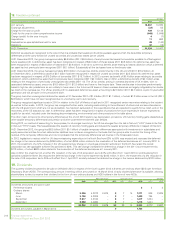
15. Exploration for and evaluation of oil and natural gas resources
The following financial information represents the amounts included within the group totals relating to activity associated with the exploration for and
evaluation of oil and natural gas resources. All such activity is recorded within the Upstream segment.
$ million
2012 2011 2010
Exploration and evaluation costs
Exploration expenditure written off 745 1,024 375
Other exploration costs 730 496 468
Exploration expense for the year 1,475 1,520 843
Intangible assets – exploration and appraisal expenditure 22,849 19,887 13,126
Liabilities 287 306 157
Net assets 22,562 19,581 12,969
Capital expenditure 5,137 8,911 6,422
Net cash used in operating activities 729 496 468
Net cash used in investing activities 4,971 8,556 6,428
Financial statements 211
BP Annual Report and Form 20-F 2012
Financial statements