BP 2012 Annual Report Download - page 7
Download and view the complete annual report
Please find page 7 of the 2012 BP annual report below. You can navigate through the pages in the report by either clicking on the pages listed below, or by using the keyword search tool below to find specific information within the annual report.-
 1
1 -
 2
2 -
 3
3 -
 4
4 -
 5
5 -
 6
6 -
 7
7 -
 8
8 -
 9
9 -
 10
10 -
 11
11 -
 12
12 -
 13
13 -
 14
14 -
 15
15 -
 16
16 -
 17
17 -
 18
18 -
19
-
20
-
21
-
22
-
23
-
24
-
25
-
26
-
27
-
28
-
29
-
30
-
31
-
32
-
33
-
34
-
35
-
36
-
37
-
38
-
39
-
40
-
41
-
42
-
43
-
44
-
45
-
46
-
47
-
48
-
49
-
50
-
51
-
52
-
53
-
54
-
55
-
56
-
57
-
58
-
59
-
60
-
61
-
62
-
63
-
64
-
65
-
66
-
67
-
68
-
69
-
70
-
71
-
72
-
73
-
74
-
75
-
76
-
77
-
78
-
79
-
80
-
81
-
82
-
83
-
84
-
85
-
86
-
87
-
88
-
89
-
90
-
91
-
92
-
93
-
94
-
95
-
96
-
97
-
98
-
99
-
100
-
101
-
102
-
103
-
104
-
105
-
106
-
107
-
108
-
109
-
110
-
111
-
112
-
113
-
114
-
115
-
116
-
117
-
118
-
119
-
120
-
121
-
122
-
123
-
124
-
125
-
126
-
127
-
128
-
129
-
130
-
131
-
132
-
133
-
134
-
135
-
136
-
137
-
138
-
139
-
140
-
141
-
142
-
143
-
144
-
145
-
146
-
147
-
148
-
149
-
150
-
151
-
152
-
153
-
154
-
155
-
156
-
157
-
158
-
159
-
160
-
161
-
162
-
163
-
164
-
165
-
166
-
167
-
168
-
169
-
170
-
171
-
172
-
173
-
174
-
175
-
176
-
177
-
178
-
179
-
180
-
181
-
182
-
183
-
184
-
185
-
186
-
187
-
188
-
189
-
190
-
191
-
192
-
193
-
194
-
195
-
196
-
197
-
198
-
199
-
200
-
201
-
202
-
203
-
204
-
205
-
206
-
207
-
208
-
209
-
210
-
211
-
212
-
213
-
214
-
215
-
216
-
217
-
218
-
219
-
220
-
221
-
222
-
223
-
224
-
225
-
226
-
227
-
228
-
229
-
230
-
231
-
232
-
233
-
234
-
235
-
236
-
237
-
238
-
239
-
240
-
241
-
242
-
243
-
244
-
245
-
246
-
247
-
248
-
249
-
250
-
251
-
252
-
253
-
254
-
255
-
256
-
257
-
258
-
259
-
260
-
261
-
262
-
263
-
264
-
265
-
266
-
267
-
268
-
269
-
270
-
271
-
272
-
273
-
274
-
275
-
276
-
277
-
278
-
279
-
280
-
281
-
282
-
283
-
284
-
285
-
286
-
287
-
288
-
289
-
290
-
291
-
292
-
293
-
294
-
295
-
296
-
297
-
298
-
299
-
300
-
301
-
302
-
303
 |
 |

BP at a glance
BP Annual Report and Form 20-F 2012
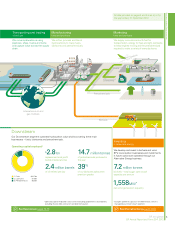
Transporting and trading
oil and gas
Marketing
fuels and products
Manufacturing
fuels and products
We move hydrocarbons using
pipelines, ships, trucks and trains
and capture value across the supply
chain.
We refine, process and blend
hydrocarbons to make fuels,
lubricants and petrochemicals.
We supply our customers with fuel for
transportation, energy for heat and light, lubricants
to keep engines moving and the petrochemicals
required to make a variety of everyday items.
7.2 million tonnes
biofuels – total sugar cane crush
capacity per annum
1,558MW e
net wind generation capacity
Downstream
Our Downstream segment operates hydrocarbon value chains covering three main
businesses – fuels, lubricants and petrochemicals.
We develop and invest in biofuels and wind.
BP’s lower-carbon businesses and investments
in future options are operated through our
Alternative Energy business.
See Downstream pages 72-79.
Lubricants
Fuels
Petrochemicals
Biofuels
International oil and
gas markets
See Alternative Energy pages 82-83.
Investing
in renewable energy
1
3
2
Operating capital employedd
1. Fuels $42.7bn
2. Lubricants $1.9bn
3. Petrochemicals $5.3bn
$2.8 bn
replacement cost profit
before interest and tax
2.4 million barrels
of oil refined per day
14.7 million tonnes
of petrochemicals produced in
the year
39%
of our lubricants sales were
premium grades
All data provided on pages 4 and 5 is as at, or for
the year ended, 31 December 2012.
d Operating capital employed is total assets (excluding goodwill) less total liabilities,
excluding finance debt and current and deferred taxation.
e Excludes 32MW of capacity in the Netherlands, which is
managed by our Downstream segment.
5
Business review: Group overview