BP 2012 Annual Report Download - page 69
Download and view the complete annual report
Please find page 69 of the 2012 BP annual report below. You can navigate through the pages in the report by either clicking on the pages listed below, or by using the keyword search tool below to find specific information within the annual report.
Business review: BP in more depth
Business review: BP in more depth
BP Annual Report and Form 20-F 2012
67
equity-accounted entities alone. For more information on proved reserves
replacement for the group, see pages 85-86.
Developments
In 2012 five major projects came onstream: Devenick in the North Sea;
Skarv in the Norwegian Sea; Clochas Mavacola and the Plutão field, part
of the Plutão, Saturno, Venus and Marte (PSVM) project in Angola; and
Galapagos in the Gulf of Mexico. In November 2012 we announced the
Savonette gas discovery offshore Trinidad.
We took final investment decisions on three projects: Juniper, Kizomba
Satellites phase 2 and Point Thomson.
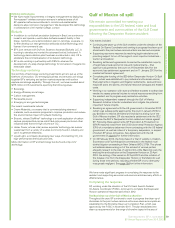
The map above shows our major development areas, which include
Angola, Australia, Azerbaijan, Canada, Egypt, the deepwater Gulf of
Mexico, North Africa and the UK North Sea. Development expenditure
of subsidiaries incurred in 2012, excluding midstream activities, was
$12.0 billion, compared with $10.2 billion in 2011 and $9.7 billion in 2010.
Production
Our oil and natural gas production assets are located onshore and offshore
and include wells, gathering centres, in-field flow lines, processing
facilities, storage facilities, offshore platforms, export systems (e.g. transit
lines), pipelines and LNG plant facilities. The principal areas of production
are Angola, Argentina, Azerbaijan, Egypt, Trinidad, the UAE, the UK and
the US.
Our total hydrocarbon production during 2012 averaged 2,319 thousand
barrels of oil equivalent per day (mboe/d). This comprised 1,963mboe/d
for subsidiaries and 355mboe/d for equity-accounted entities, a decrease
of 6% (decreases of 10% for liquids and 3% for gas) and a decrease of
3% (decrease of 3% for liquids and no change for gas) respectively
compared with 2011. For subsidiaries, 34% of our production was in the
US, 19% in Trinidad and 8% in the UK.
In aggregate, after adjusting for the impact of price movements on our
entitlement to production in our PSAs and the effect of acquisitions and
disposals, underlying production was broadly flat compared with 2011.
This primarily reflects major project start-ups and improved operating
performance in Angola, partly offset by natural field decline and the
impact of turnaround and maintenance activities.
The group and its equity-accounted entities have numerous long-term
sales commitments in their various business activities, all of which are
expected to be sourced from supplies available to the group that are not
subject to priorities, curtailments or other restrictions. No single contract
or group of related contracts is material to the group.
Regional summary
The following discussion reviews operations in our upstream business by
geographical area, and lists associated significant events. BP’s percentage
working interest in oil and gas assets is shown in brackets. Working
interest is the cost-bearing ownership share of an oil or gas lease.
Consequently, the percentages disclosed for certain agreements do not
necessarily reflect the percentage interests in reserves and production.
Europe
In Europe, BP is active in the UK North Sea and the Norwegian Sea. Key
aspects of our activities in the North Sea include a focus on in-field drilling
and selected new field developments. We are the largest producer of
hydrocarbons in the UK.
t On 16 November 2010, production from the Rhum gas field in the
central North Sea was suspended following the imposition of EU
sanctions on Iran. Rhum is owned by BP (50%) and the Iranian Oil
Company (50%) under a joint operating agreement dating back to the
early 1970s. Rhum remains shut-in. See Further note on certain
activities on page 45 for further information.
t In October 2012 BP announced the start-up of the Devenick gas project
in the central North Sea. It was subsequently announced in November
M
a
j
or pro
j
ects port
f
o
li
o
Norway
Hod redevelopment
North Sea
Quad 204
Clair Ridge
Egypt
West Nile Delta
East Nile Delta low
pressure hub
Azerbaijan
Azeri subsea
Shah Deniz 2
Chirag oil
Gulf of Mexico
Na Kika phase 3
Mars B
Mad Dog phase 2
Freedom
Moccasin
Thunder Horse expansion
Thunder Horse WI 2
Canada
Sunrise 1
Pike 1
Sunrise 2
Terre de Grace
Alaska
Alaska Viscous Oil
Point Thomson
On track for 2013/14 start-up.
Being progressed for 2015 and beyond.
Brazil
Itaipú
Trinidad & Tobago
Juniper
Manakin
Middle East
Oman Khazzan
Angola
Angola LNG
CLOV
B31 SE
B18 PCC
Greater Plutonio 3
Kizomba Satellites 2
Zinia 2
North Africa
Bourarhet
India
KGD6
Indonesia
Sanga Sanga CBM
Tangguh expansion
Australia
Western Flank A
Western Flank B
Persephone
Kinnoull
Satis
North Rankin 2
In Salah gas southern fields
In Amenas compression


