BP 2012 Annual Report Download - page 23
Download and view the complete annual report
Please find page 23 of the 2012 BP annual report below. You can navigate through the pages in the report by either clicking on the pages listed below, or by using the keyword search tool below to find specific information within the annual report.-
 1
1 -
2
-
3
-
4
-
5
-
6
-
7
-
8
-
9
-
10
-
11
-
12
-
 13
13 -
 14
14 -
 15
15 -
 16
16 -
 17
17 -
 18
18 -
 19
19 -
 20
20 -
 21
21 -
 22
22 -
 23
23 -
 24
24 -
 25
25 -
 26
26 -
 27
27 -
 28
28 -
 29
29 -
 30
30 -
 31
31 -
 32
32 -
 33
33 -
34
-
35
-
36
-
37
-
38
-
39
-
40
-
41
-
42
-
43
-
44
-
45
-
46
-
47
-
48
-
49
-
50
-
51
-
52
-
53
-
54
-
55
-
56
-
57
-
58
-
59
-
60
-
61
-
62
-
63
-
64
-
65
-
66
-
67
-
68
-
69
-
70
-
71
-
72
-
73
-
74
-
75
-
76
-
77
-
78
-
79
-
80
-
81
-
82
-
83
-
84
-
85
-
86
-
87
-
88
-
89
-
90
-
91
-
92
-
93
-
94
-
95
-
96
-
97
-
98
-
99
-
100
-
101
-
102
-
103
-
104
-
105
-
106
-
107
-
108
-
109
-
110
-
111
-
112
-
113
-
114
-
115
-
116
-
117
-
118
-
119
-
120
-
121
-
122
-
123
-
124
-
125
-
126
-
127
-
128
-
129
-
130
-
131
-
132
-
133
-
134
-
135
-
136
-
137
-
138
-
139
-
140
-
141
-
142
-
143
-
144
-
145
-
146
-
147
-
148
-
149
-
150
-
151
-
152
-
153
-
154
-
155
-
156
-
157
-
158
-
159
-
160
-
161
-
162
-
163
-
164
-
165
-
166
-
167
-
168
-
169
-
170
-
171
-
172
-
173
-
174
-
175
-
176
-
177
-
178
-
179
-
180
-
181
-
182
-
183
-
184
-
185
-
186
-
187
-
188
-
189
-
190
-
191
-
192
-
193
-
194
-
195
-
196
-
197
-
198
-
199
-
200
-
201
-
202
-
203
-
204
-
205
-
206
-
207
-
208
-
209
-
210
-
211
-
212
-
213
-
214
-
215
-
216
-
217
-
218
-
219
-
220
-
221
-
222
-
223
-
224
-
225
-
226
-
227
-
228
-
229
-
230
-
231
-
232
-
233
-
234
-
235
-
236
-
237
-
238
-
239
-
240
-
241
-
242
-
243
-
244
-
245
-
246
-
247
-
248
-
249
-
250
-
251
-
252
-
253
-
254
-
255
-
256
-
257
-
258
-
259
-
260
-
261
-
262
-
263
-
264
-
265
-
266
-
267
-
268
-
269
-
270
-
271
-
272
-
273
-
274
-
275
-
276
-
277
-
278
-
279
-
280
-
281
-
282
-
283
-
284
-
285
-
286
-
287
-
288
-
289
-
290
-
291
-
292
-
293
-
294
-
295
-
296
-
297
-
298
-
299
-
300
-
301
-
302
-
303
 |
 |

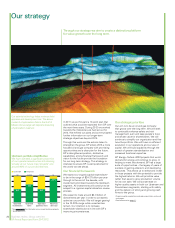
We will pursue new opportunities by applying
our distinctive strengths of relationships,
technology and a strong balance sheet. Our
past experience of co-ordinating complex
projects around the world can help us to gain
access to new areas.
Business model
For more information on our distinctive
strengths and how we create value see
pages 15-19.
Upstream
Our analysis indicates that oil offers us the
most attractive opportunities. Our investments
will therefore be biased to oil. We also believe
there will be opportunities to create high
returns from advantaged gas assets.
We have a long track record of value creation
through exploration. We will invest in our
strong incumbent positions and look for new
opportunities. Deepwater developments can
provide good opportunities for companies with
the requisite expertise. We will utilize our
scale and capability as we invest further in this
area. We believe we are able to manage scale
and complexity, and improve the recovery of
conventional and unconventional resources.
We expect to continue to invest in giant
fields, where this expertise is particularly
valuable.
We believe our ability to integrate complex
gas value chains is another key strength.
We intend to hold a portfolio of gas positions
selected according to expected returns, with
a balance across conventional and
unconventional gas. We will optimize these
through our trading activities.
We are committed to Russia and the Middle
East – areas where we have a long history.
Downstream
We believe BP has world-class downstream
operations with a strong and improving track
record of performance in recent years. We
will continue to focus on safe and reliable
operations and excellent execution, together
with disciplined investment and portfolio
management. Our focus on portfolio quality
will include improving the margin capability of
all of our businesses, and a focus on investing
in attractive markets.
As the world changes, we expect to increase
our exposure to growth markets and demand
from new consumers.
Longer-term objectives
Maintain momentum on safety and risk reduction.
Develop and apply new technologies that access new hydrocarbons or extract and
process them more efficiently.
Upstream
Generate strong returns within a disciplined financial framework.
Deliver growth through increased reinvestment in higher return opportunities.
Maintain our strong incumbent positions and a diversified portfolio of deep water, giant fields
and gas value chains.
Build material new positions for the long term.
Downstream
Grow free cash flow.e
Reduce our exposure to refining when not part of an integrated value chain.
Re-orientate the geographic mix of our downstream footprint to growth markets.
10-point plan
Launched in October 2011 and set out in
BP Annual Report and Form 20-F 2011, our
10-point plan described our intentions for
building a stronger, safer BP.
What you can expect
1 A relentless focus on safety and managing risk
through the systematic application of global standards.
2 We will play to our strengths in exploration,
deep water, giant fields and gas value chains.
3 Stronger and more focused with an asset base that
is high graded and higher performing.
4 Simpler and more standardized with fewer
assets and operations in fewer countries; more
streamlined internal reward and performance
management processes.
5 Improved transparency through reporting TNK-BP
as a separate segment and breaking out the
numbers for the three downstream businesses.
What you can measure
6 Active portfolio management to continue by
completing $38 billion of disposals over the four
years to the end of 2013, in order to focus on our
strengths.
7 We expect to bring new upstream projects
onstream with unit operating cash marginsa around
double the 2011 average by 2014.b
8 We are aiming to generate an increase of around 50%
in net cash provided by operating activities by 2014
compared with 2011.c
9 We intend to use half our incremental operating
cash for reinvestment, half for other purposes.
10 Strong balance sheet with intention to target our
level of gearingd in the lower half of the 10-20%
range over time.
a Unit cash margin is net cash provided by operating activities for
the relevant projects in our Upstream segment, divided by the
total number of barrels of oil and gas equivalent produced for the
relevant projects. It excludes dividends and production for
TNK-BP.
b Assuming a constant oil price of $100 per barrel.
c Assuming an oil price of $100 per barrel and a Henry Hub gas
price of $5/mmBtu in 2014. The projection assumes the
completion of the agreed transaction with Rosneft and receipt of
the projected Rosneft dividend and excludes BP’s share of the
TNK-BP dividends from operating cash flow for 2011 and 2014.
The projection includes BP’s payment commitments under the
Department of Justice and SEC settlements. It does not reflect
any cash flows relating to other liabilities, contingent liabilities,
settlements or contingent assets arising from the Gulf of Mexico
oil spill which may or may not arise at that time. We are not able
to reliably estimate the amount or timing of a number of
contingent liabilities. See Financial statements – Note 43 on
page 253 for further information.
d Gearing refers to the ratio of the group’s net debt to net debt
plus equity and is a non-GAAP measure. See Financial
statements – Note 35 on page 234 for further information
including a reconciliation to gross debt, which is the nearest
equivalent measure on an IFRS basis.
e Free cash flow: net cash provided by operating activities less
net cash used in investing activities.
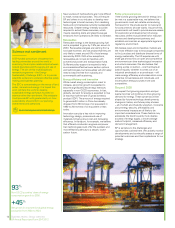
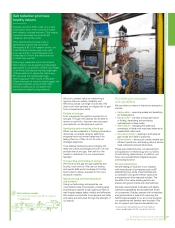
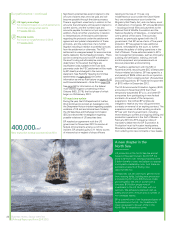
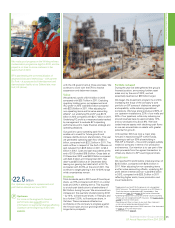
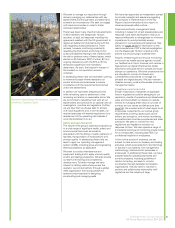
The Skarv floating production, storage and
offloading unit – one of the major project start-ups
in 2012 – on tow in a Norwegian fjord.
Business review: Group overview
BP Annual Report and Form 20-F 2012 21
Business review: Group overview