BP 2012 Annual Report Download - page 65
Download and view the complete annual report
Please find page 65 of the 2012 BP annual report below. You can navigate through the pages in the report by either clicking on the pages listed below, or by using the keyword search tool below to find specific information within the annual report.-
 1
1 -
2
-
3
-
4
-
5
-
6
-
7
-
8
-
9
-
10
-
11
-
12
-
13
-
14
-
15
-
16
-
17
-
18
-
19
-
20
-
21
-
22
-
23
-
24
-
25
-
26
-
27
-
28
-
29
-
30
-
31
-
32
-
33
-
34
-
35
-
36
-
37
-
38
-
39
-
40
-
41
-
42
-
43
-
44
-
45
-
46
-
47
-
48
-
49
-
50
-
51
-
52
-
53
-
54
-
 55
55 -
 56
56 -
 57
57 -
 58
58 -
 59
59 -
 60
60 -
 61
61 -
 62
62 -
 63
63 -
 64
64 -
 65
65 -
 66
66 -
 67
67 -
 68
68 -
 69
69 -
 70
70 -
 71
71 -
 72
72 -
 73
73 -
 74
74 -
 75
75 -
76
-
77
-
78
-
79
-
80
-
81
-
82
-
83
-
84
-
85
-
86
-
87
-
88
-
89
-
90
-
91
-
92
-
93
-
94
-
95
-
96
-
97
-
98
-
99
-
100
-
101
-
102
-
103
-
104
-
105
-
106
-
107
-
108
-
109
-
110
-
111
-
112
-
113
-
114
-
115
-
116
-
117
-
118
-
119
-
120
-
121
-
122
-
123
-
124
-
125
-
126
-
127
-
128
-
129
-
130
-
131
-
132
-
133
-
134
-
135
-
136
-
137
-
138
-
139
-
140
-
141
-
142
-
143
-
144
-
145
-
146
-
147
-
148
-
149
-
150
-
151
-
152
-
153
-
154
-
155
-
156
-
157
-
158
-
159
-
160
-
161
-
162
-
163
-
164
-
165
-
166
-
167
-
168
-
169
-
170
-
171
-
172
-
173
-
174
-
175
-
176
-
177
-
178
-
179
-
180
-
181
-
182
-
183
-
184
-
185
-
186
-
187
-
188
-
189
-
190
-
191
-
192
-
193
-
194
-
195
-
196
-
197
-
198
-
199
-
200
-
201
-
202
-
203
-
204
-
205
-
206
-
207
-
208
-
209
-
210
-
211
-
212
-
213
-
214
-
215
-
216
-
217
-
218
-
219
-
220
-
221
-
222
-
223
-
224
-
225
-
226
-
227
-
228
-
229
-
230
-
231
-
232
-
233
-
234
-
235
-
236
-
237
-
238
-
239
-
240
-
241
-
242
-
243
-
244
-
245
-
246
-
247
-
248
-
249
-
250
-
251
-
252
-
253
-
254
-
255
-
256
-
257
-
258
-
259
-
260
-
261
-
262
-
263
-
264
-
265
-
266
-
267
-
268
-
269
-
270
-
271
-
272
-
273
-
274
-
275
-
276
-
277
-
278
-
279
-
280
-
281
-
282
-
283
-
284
-
285
-
286
-
287
-
288
-
289
-
290
-
291
-
292
-
293
-
294
-
295
-
296
-
297
-
298
-
299
-
300
-
301
-
302
-
303
 |
 |

Business review: BP in more depth
Business review: BP in more depth
BP Annual Report and Form 20-F 2012
63
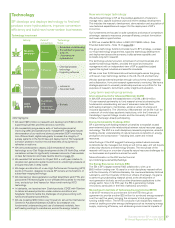
Upstream
In 2012 we continued to actively manage and
simplify our portfolio, strengthening our incumbent
positions to provide a platform for growth in the future.
What we do
We are focused on accessing and extracting oil and gas through all
stages of the life cycle and we deliver these activities through three
separate divisions:
Exploration – responsible for renewing our resource base through
access, exploration and appraisal.
Developments – ensures the safe, reliable and compliant execution of
wells (drilling and completions) and major projects and comprises the
global wells organization and the global projects organization.
Production – ensures safe, reliable and compliant operations, including
upstream production assets, midstream transportation and processing
activities, and the development of our resource base.
These activities are optimized and integrated with support from global
functions with specialist areas of expertise and the group’s strategy and
integration organization, which comprises finance, procurement and
supply chain, human resources, technology and information technology.
Our Upstream segment includes upstream and midstream activities, and
gas marketing and trading activities in 28 countries with production from
19 countries, see pages 6-7.
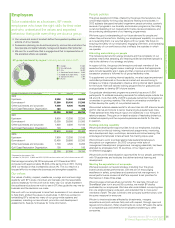
Our market – 2012 summary
t Growth in world oil consumption remains weak.
t Brent continued to be the main driver of oil price realizations; other
principal local markers included West Texas Intermediate (WTI) and
Alaska North Slope (ANS).
t Brent averaged $111.67 per barrel, similar to 2011’s average of $111.26
per barrel.
t Continued divergence in natural gas prices with US Henry Hub First of
Month Index falling 31% to average $2.79/mmBtu in 2012, while
European spot prices increased.
0
120
150
60
90
30
Jan Feb Mar Apr May Jun Jul Aug Sep Oct Nov Dec
2011
Brent ($/bbl)
5-year range (2007-2011) 2012
0
12
15
6
9
3
Jan Feb Mar Apr May Jun Jul Aug Sep Oct Nov Dec
Henry Hub ($/mmBtu)
2011
5-year range (2007-2011) 2012
Our strategy
In Upstream, our highest priority is to ensure safe, reliable and compliant
operations worldwide. Our strategy is to invest to grow long-term value
by continuing to build a portfolio of material, enduring positions in the
world’s key hydrocarbon basins. Our strategy is enabled by:
t A continued focus on safety and the systematic management of risk.
t Playing to our strengths – exploration, giant fields, deepwater and gas
value chains.
t A simplified portfolio with strengthened incumbent positions and
reduced operating complexity.
t An execution model that drives improvement in efficiency and reliability
– through both operations and investment.
t A bias to oil while maintaining a balance of gas markets and resource
types.
t Strong relationships built on mutual advantage, deep knowledge of the
basins in which we operate, and technology.
We intend to gradually increase investment with a focus on exploration,
a key source of value creation, and evolve the nature of our relationships,
particularly with national oil companies.
Our performance – 2012 summary
t The safety metrics of day away from work case frequency and loss of
primary containment improved compared with 2011 (see page 64).
t In 2012 replacement cost profit before interest and tax for the segment
was $22.5 billion, compared with $26.4 billion in 2011. After adjusting for
non-operating items and fair value accounting effects, underlying
replacement cost profita before interest and tax in 2012 was $19.4 billion
compared with $25.2 billion for the previous year (see page 65).
t Our exploration division gained access to potential new resources in six
countries, covering more than 68,000km2 in 2012.
t In 2012 there were five major upstream project start-ups.
t Disposal transactions generated $10.7 billion in proceeds in 2012.
Upstream profitability ($ billion)
Underlying RC profit before interest and taxa
RC profit before interest and tax
2008 2009 2010 2011 2012
50
40
30
20
10
Outlook
t In 2013 we expect reported production to be lower than 2012, mainly
due to the impact of divestments which we estimate at around
150mboe/d. After adjusting for the impacts of divestments and
entitlement effects in our PSAs, we expect underlying production to
grow.
t We expect four major projects to come onstream towards the end of
2013, with a further six in 2014.
t We expect to make the final investment decision (FID) on five projects
in 2013.
t Capital investment in 2013 will increase, reflecting the progression of our
major projects and the increases in exploration and access activity.
t We remain on track to deliver Upstream’s contribution to the group’s
plan to generate an increase of around 50% in operating cash flow by
2014 compared with 2011.b
a Underlying replacement cost profit before interest and tax is not a recognized GAAP measure.
See footnote b on page 34 for further information. The equivalent measure on an IFRS basis is
replacement cost profit before interest and tax.
b See footnote c on page 21.