BP 2012 Annual Report Download - page 226
Download and view the complete annual report
Please find page 226 of the 2012 BP annual report below. You can navigate through the pages in the report by either clicking on the pages listed below, or by using the keyword search tool below to find specific information within the annual report.-
 1
1 -
2
-
3
-
4
-
5
-
6
-
7
-
8
-
9
-
10
-
11
-
12
-
13
-
14
-
15
-
16
-
17
-
18
-
19
-
20
-
21
-
22
-
23
-
24
-
25
-
26
-
27
-
28
-
29
-
30
-
31
-
32
-
33
-
34
-
35
-
36
-
37
-
38
-
39
-
40
-
41
-
42
-
43
-
44
-
45
-
46
-
47
-
48
-
49
-
50
-
51
-
52
-
53
-
54
-
55
-
56
-
57
-
58
-
59
-
60
-
61
-
62
-
63
-
64
-
65
-
66
-
67
-
68
-
69
-
70
-
71
-
72
-
73
-
74
-
75
-
76
-
77
-
78
-
79
-
80
-
81
-
82
-
83
-
84
-
85
-
86
-
87
-
88
-
89
-
90
-
91
-
92
-
93
-
94
-
95
-
96
-
97
-
98
-
99
-
100
-
101
-
102
-
103
-
104
-
105
-
106
-
107
-
108
-
109
-
110
-
111
-
112
-
113
-
114
-
115
-
116
-
117
-
118
-
119
-
120
-
121
-
122
-
123
-
124
-
125
-
126
-
127
-
128
-
129
-
130
-
131
-
132
-
133
-
134
-
135
-
136
-
137
-
138
-
139
-
140
-
141
-
142
-
143
-
144
-
145
-
146
-
147
-
148
-
149
-
150
-
151
-
152
-
153
-
154
-
155
-
156
-
157
-
158
-
159
-
160
-
161
-
162
-
163
-
164
-
165
-
166
-
167
-
168
-
169
-
170
-
171
-
172
-
173
-
174
-
175
-
176
-
177
-
178
-
179
-
180
-
181
-
182
-
183
-
184
-
185
-
186
-
187
-
188
-
189
-
190
-
191
-
192
-
193
-
194
-
195
-
196
-
197
-
198
-
199
-
200
-
201
-
202
-
203
-
204
-
205
-
206
-
207
-
208
-
209
-
210
-
211
-
212
-
213
-
214
-
215
-
 216
216 -
 217
217 -
 218
218 -
 219
219 -
 220
220 -
 221
221 -
 222
222 -
 223
223 -
 224
224 -
 225
225 -
 226
226 -
 227
227 -
 228
228 -
 229
229 -
 230
230 -
 231
231 -
 232
232 -
 233
233 -
 234
234 -
 235
235 -
 236
236 -
237
-
238
-
239
-
240
-
241
-
242
-
243
-
244
-
245
-
246
-
247
-
248
-
249
-
250
-
251
-
252
-
253
-
254
-
255
-
256
-
257
-
258
-
259
-
260
-
261
-
262
-
263
-
264
-
265
-
266
-
267
-
268
-
269
-
270
-
271
-
272
-
273
-
274
-
275
-
276
-
277
-
278
-
279
-
280
-
281
-
282
-
283
-
284
-
285
-
286
-
287
-
288
-
289
-
290
-
291
-
292
-
293
-
294
-
295
-
296
-
297
-
298
-
299
-
300
-
301
-
302
-
303
 |
 |

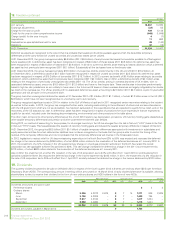
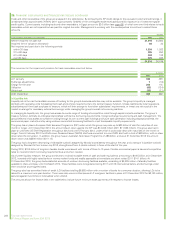
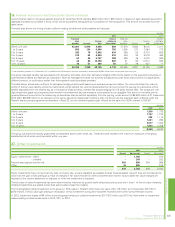
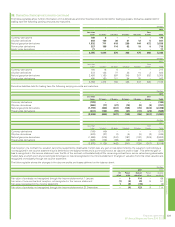
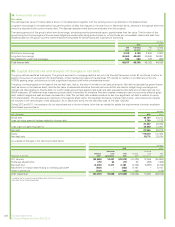
26. Financial instruments and financial risk factors continued
Trade and other receivables of the group are analysed in the table below. By comparing the BP credit ratings to the equivalent external credit ratings, it
is estimated that approximately 70-80% (2011 approximately 70-80%) of the unmitigated trade receivables portfolio exposure is of investment grade
credit quality. Current assets, including trade and other receivables, in Egypt amount to $3.0 billion (see page 69), of which over one third relates to trade
receivables which are not impaired but are past the original due date. Management is working with the counterparties to continue to collect these
amounts.
$ million
Trade and other receivables at 31 December 2012 2011
Neither impaired nor past due 31,916 34,563
Impaired (net of valuation allowance) 80 33
Not impaired and past due in the following periods
within 30 days 1,334 1,263
31 to 60 days 285 250
61 to 90 days 224 132
over 90 days 975 638
34,814 36,879
The movement in the impairment provision for trade receivables is set out below.
$ million
2012 2011
At 1 January 332 428
Exchange adjustments 7(16)
Charge for the year 240 115
Utilization (65) (124)
Write back (25) (71)
At 31 December 489 332
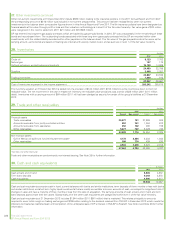
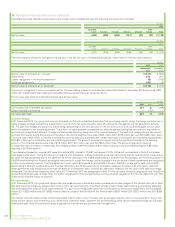
(c) Liquidity risk
Liquidity risk is the risk that suitable sources of funding for the group’s business activities may not be available. The group’s liquidity is managed
centrally with operating units forecasting their cash and currency requirements to the central treasury function. Unless restricted by local regulations,
subsidiaries pool their cash surpluses to treasury, which will then arrange to fund other subsidiaries’ requirements, or invest any net surplus in the
market or arrange for necessary external borrowings, while managing the group’s overall net currency positions.
In managing its liquidity risk, the group has access to a wide range of funding at competitive rates through capital markets and banks. The group’s
treasury function centrally co-ordinates relationships with banks, borrowing requirements, foreign exchange requirements and cash management. The
group believes it has access to sufficient funding through its own current cash holdings and future cash generation including disposal proceeds, the
commercial paper markets and by using undrawn committed borrowing facilities to meet foreseeable liquidity requirements.
The group has in place a European Debt Issuance Programme (DIP) under which the group may raise up to $20 billion of debt for maturities of one
month or longer. At 31 December 2012, the amount drawn down against the DIP was $14,043 million (2011 $11,582 million). The group also had in
place an unlimited US Shelf Registration throughout 2012 and until 5 February 2013, under which it could raise debt with maturities of one month or
longer. From 5 February 2013 the Well-known Seasoned Issuer (WKSI) shelf was converted to a non-WKSI shelf with a limit of $30 billion, with no draw
down since the conversion. In addition, the group has an Australian Note Issue Programme of A$5 billion, and as at 31 December 2012 the amount
drawn down was A$500 million (2011 nil).
The group had a long-term debt rating of A2 (stable outlook) assigned by Moody’s consistently throughout the year, and a rating of A (positive outlook)
assigned by Standard & Poor’s since July 2012, strengthened from A (stable outlook) in force at the start of the year.
During 2012, $10.9 billion of long-term taxable bonds were issued with tenors of three to 10 years. Flexible commercial paper is issued at competitive
rates to meet short-term borrowing requirements as and when needed.
As a further liquidity measure, the group continues to maintain suitable levels of cash and cash equivalents, amounting to $19.5 billion at 31 December
2012, invested with highly rated banks or money market funds and readily accessible at immediate and short notice (2011 $14.1 billion). At
31 December 2012, the group had substantial amounts of undrawn borrowing facilities available, consisting of $6,825 million of standby facilities
available to draw and repay until mid-March 2014. These facilities were renegotiated during 2011 with 23 international banks, and borrowings under
them would be at pre-agreed rates.
The group also has committed letter of credit (LC) facilities totalling $6,925 million with a number of banks for a one-year duration, allowing LCs to be
issued to a maximum one-year duration. There were also uncommitted secured LC evergreen facilities in place at 31 December 2012 for $2,160 million,
secured against inventories or receivables when utilized.
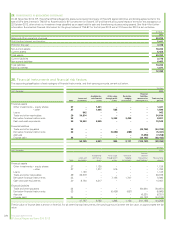
The amounts shown for finance debt in the table below include future minimum lease payments with respect to finance leases.
224 Financial statements
BP Annual Report and Form 20-F 2012