BP 2012 Annual Report Download - page 100
Download and view the complete annual report
Please find page 100 of the 2012 BP annual report below. You can navigate through the pages in the report by either clicking on the pages listed below, or by using the keyword search tool below to find specific information within the annual report.-
 1
1 -
2
-
3
-
4
-
5
-
6
-
7
-
8
-
9
-
10
-
11
-
12
-
13
-
14
-
15
-
16
-
17
-
18
-
19
-
20
-
21
-
22
-
23
-
24
-
25
-
26
-
27
-
28
-
29
-
30
-
31
-
32
-
33
-
34
-
35
-
36
-
37
-
38
-
39
-
40
-
41
-
42
-
43
-
44
-
45
-
46
-
47
-
48
-
49
-
50
-
51
-
52
-
53
-
54
-
55
-
56
-
57
-
58
-
59
-
60
-
61
-
62
-
63
-
64
-
65
-
66
-
67
-
68
-
69
-
70
-
71
-
72
-
73
-
74
-
75
-
76
-
77
-
78
-
79
-
80
-
81
-
82
-
83
-
84
-
85
-
86
-
87
-
88
-
89
-
 90
90 -
 91
91 -
 92
92 -
 93
93 -
 94
94 -
 95
95 -
 96
96 -
 97
97 -
 98
98 -
 99
99 -
 100
100 -
 101
101 -
 102
102 -
 103
103 -
 104
104 -
 105
105 -
 106
106 -
 107
107 -
 108
108 -
 109
109 -
 110
110 -
111
-
112
-
113
-
114
-
115
-
116
-
117
-
118
-
119
-
120
-
121
-
122
-
123
-
124
-
125
-
126
-
127
-
128
-
129
-
130
-
131
-
132
-
133
-
134
-
135
-
136
-
137
-
138
-
139
-
140
-
141
-
142
-
143
-
144
-
145
-
146
-
147
-
148
-
149
-
150
-
151
-
152
-
153
-
154
-
155
-
156
-
157
-
158
-
159
-
160
-
161
-
162
-
163
-
164
-
165
-
166
-
167
-
168
-
169
-
170
-
171
-
172
-
173
-
174
-
175
-
176
-
177
-
178
-
179
-
180
-
181
-
182
-
183
-
184
-
185
-
186
-
187
-
188
-
189
-
190
-
191
-
192
-
193
-
194
-
195
-
196
-
197
-
198
-
199
-
200
-
201
-
202
-
203
-
204
-
205
-
206
-
207
-
208
-
209
-
210
-
211
-
212
-
213
-
214
-
215
-
216
-
217
-
218
-
219
-
220
-
221
-
222
-
223
-
224
-
225
-
226
-
227
-
228
-
229
-
230
-
231
-
232
-
233
-
234
-
235
-
236
-
237
-
238
-
239
-
240
-
241
-
242
-
243
-
244
-
245
-
246
-
247
-
248
-
249
-
250
-
251
-
252
-
253
-
254
-
255
-
256
-
257
-
258
-
259
-
260
-
261
-
262
-
263
-
264
-
265
-
266
-
267
-
268
-
269
-
270
-
271
-
272
-
273
-
274
-
275
-
276
-
277
-
278
-
279
-
280
-
281
-
282
-
283
-
284
-
285
-
286
-
287
-
288
-
289
-
290
-
291
-
292
-
293
-
294
-
295
-
296
-
297
-
298
-
299
-
300
-
301
-
302
-
303
 |
 |

Business review: BP in more depth
BP Annual Report and Form 20-F 2012
98
Certain definitions
Unless the context indicates otherwise, the following terms have the
meaning shown below:
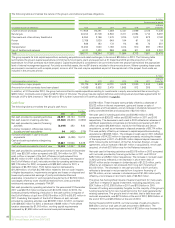
Replacement cost profit
Replacement cost (RC) profit or loss reflects the replacement cost of
supplies and is arrived at by excluding inventory holding gains and losses
from profit or loss. IFRS requires that the measure of profit or loss
disclosed for each operating segment is the measure that is provided
regularly to the chief operating decision maker for the purposes of
performance assessment and resource allocation. For BP, both RC profit
or loss before interest and tax and underlying RC profit or loss before
interest and tax are provided regularly to the chief operating decision
maker. In such cases IFRS requires that the measure of profit disclosed
for each operating segment is the measure that is closest to IFRS, which
for BP is RC profit or loss before interest and tax. RC profit or loss for the
group is not a recognized GAAP measure. The nearest equivalent GAAP
measure is profit or loss for the year attributable to BP shareholders. BP
believes that replacement cost profit before interest and taxation for the
group is a useful measure for investors because it is a profitability
measure used by management. A reconciliation is provided between the
total of the operating segments’ measures of profit or loss and the group
profit or loss before taxation, as required under IFRS. See Financial
statements – Note 6 on page 203.
Inventory holding gains and losses
Inventory holding gains and losses represent the difference between the
cost of sales calculated using the average cost to BP of supplies acquired
during the period and the cost of sales calculated on the first-in first-out
(FIFO) method after adjusting for any changes in provisions where the net
realizable value of the inventory is lower than its cost. Under the FIFO
method, which we use for IFRS reporting, the cost of inventory charged
to the income statement is based on its historic cost of purchase, or
manufacture, rather than its replacement cost. In volatile energy markets,
this can have a significant distorting effect on reported income. The
amounts disclosed represent the difference between the charge (to the
income statement) for inventory on a FIFO basis (after adjusting for any
related movements in net realizable value provisions) and the charge that
would have arisen if an average cost of supplies was used for the period.
For this purpose, the average cost of supplies during the period is
principally calculated on a monthly basis by dividing the total cost of
inventory acquired in the period by the number of barrels acquired. The
amounts disclosed are not separately reflected in the financial statements
as a gain or loss. No adjustment is made in respect of the cost of
inventories held as part of a trading position and certain other temporary
inventory positions.
Management believes this information is useful to illustrate to investors
the fact that crude oil and product prices can vary significantly from period
to period and that the impact on our reported result under IFRS can be
significant. Inventory holding gains and losses vary from period to period
due principally to changes in oil prices as well as changes to underlying
inventory levels. In order for investors to understand the operating
performance of the group excluding the impact of oil price changes on the
replacement of inventories, and to make comparisons of operating
performance between reporting periods, BP’s management believes it is
helpful to disclose this information.
Underlying replacement cost profit
Underlying RC profit or loss is RC profit or loss after adjusting for
non-operating items and fair value accounting effects. Underlying RC
profit or loss and fair value accounting effects are not recognized GAAP
measures. On page 37 we provide additional information on the non-
operating items and fair value accounting effects that are used to arrive at
underlying RC profit or loss in order to enable a full understanding of the
events and their financial impact.
BP believes that underlying RC profit or loss before interest and taxation is
a useful measure for investors because it is a measure closely tracked by
management to evaluate BP’s operating performance and to make
financial, strategic and operating decisions and because it may help
investors to understand and evaluate, in the same manner as
management, the underlying trends in BP’s operational performance on a
comparable basis, year on year, by adjusting for the effects of these
non-operating items and fair value accounting effects. The nearest
equivalent measure on an IFRS basis for the group is profit or loss for the
year attributable to BP shareholders. The nearest equivalent measure on
an IFRS basis for segments is RC profit or loss before interest and taxation.
Non-GAAP information on fair value accounting effects
BP uses derivative instruments to manage the economic exposure
relating to inventories above normal operating requirements of crude oil,
natural gas and petroleum products. Under IFRS, these inventories are
recorded at historic cost. The related derivative instruments, however, are
required to be recorded at fair value with gains and losses recognized in
income because hedge accounting is either not permitted or not followed,
principally due to the impracticality of effectiveness testing requirements.
Therefore, measurement differences in relation to recognition of gains and
losses occur. Gains and losses on these inventories are not recognized
until the commodity is sold in a subsequent accounting period. Gains and
losses on the related derivative commodity contracts are recognized in the
income statement from the time the derivative commodity contract is
entered into on a fair value basis using forward prices consistent with the
contract maturity.
BP enters into commodity contracts to meet certain business
requirements, such as the purchase of crude for a refinery or the sale of
BP’s gas production. Under IFRS these contracts are treated as
derivatives and are required to be fair valued when they are managed as
part of a larger portfolio of similar transactions. Gains and losses arising
are recognized in the income statement from the time the derivative
commodity contract is entered into.
IFRS requires that inventory held for trading be recorded at its fair value
using period end spot prices whereas any related derivative commodity
instruments are required to be recorded at values based on forward prices
consistent with the contract maturity. Depending on market conditions,
these forward prices can be either higher or lower than spot prices
resulting in measurement differences.
BP enters into contracts for pipelines and storage capacity, oil and gas
processing and liquefied natural gas (LNG) that, under IFRS, are recorded
on an accruals basis. These contracts are risk-managed using a variety of
derivative instruments, which are fair valued under IFRS. This results in
measurement differences in relation to recognition of gains and losses.
The way that BP manages the economic exposures described above, and
measures performance internally, differs from the way these activities are
measured under IFRS. BP calculates this difference for consolidated
entities by comparing the IFRS result with management’s internal
measure of performance. Under management’s internal measure of
performance the inventory, capacity, oil and gas processing and LNG
contracts in question are valued based on fair value using relevant forward
prices prevailing at the end of the period and the commodity contracts for
business requirements are accounted for on an accruals basis. We believe
that disclosing management’s estimate of this difference provides useful
information for investors because it enables investors to see the economic
effect of these activities as a whole. The impacts of fair value accounting
effects, relative to management’s internal measure of performance and a
reconciliation to GAAP information is shown on page 37.
Commodity trading contracts
BP’s Upstream and Downstream segments both participate in regional
and global commodity trading markets in order to manage, transact and
hedge the crude oil, refined products and natural gas that the group either
produces or consumes in its manufacturing operations. These physical
trading activities, together with associated incremental trading
opportunities, are discussed further in Upstream on page 71 and in
Downstream on page 77. The range of contracts the group enters into in
its commodity trading operations is as follows.
Exchange-traded commodity derivatives
These contracts are typically in the form of futures and options traded on
a recognized exchange, such as Nymex, SGX and ICE. Such contracts are
traded in standard specifications for the main marker crude oils, such as
Brent and West Texas Intermediate, the main product grades, such as
gasoline and gasoil, and for natural gas and power. Gains and losses,
otherwise referred to as variation margins, are settled on a daily basis with
the relevant exchange. These contracts are used for the trading and risk