BP 2012 Annual Report Download - page 27
Download and view the complete annual report
Please find page 27 of the 2012 BP annual report below. You can navigate through the pages in the report by either clicking on the pages listed below, or by using the keyword search tool below to find specific information within the annual report.-
 1
1 -
2
-
3
-
4
-
5
-
6
-
7
-
8
-
9
-
10
-
11
-
12
-
13
-
14
-
15
-
16
-
 17
17 -
 18
18 -
 19
19 -
 20
20 -
 21
21 -
 22
22 -
 23
23 -
 24
24 -
 25
25 -
 26
26 -
 27
27 -
 28
28 -
 29
29 -
 30
30 -
 31
31 -
 32
32 -
 33
33 -
 34
34 -
 35
35 -
 36
36 -
 37
37 -
38
-
39
-
40
-
41
-
42
-
43
-
44
-
45
-
46
-
47
-
48
-
49
-
50
-
51
-
52
-
53
-
54
-
55
-
56
-
57
-
58
-
59
-
60
-
61
-
62
-
63
-
64
-
65
-
66
-
67
-
68
-
69
-
70
-
71
-
72
-
73
-
74
-
75
-
76
-
77
-
78
-
79
-
80
-
81
-
82
-
83
-
84
-
85
-
86
-
87
-
88
-
89
-
90
-
91
-
92
-
93
-
94
-
95
-
96
-
97
-
98
-
99
-
100
-
101
-
102
-
103
-
104
-
105
-
106
-
107
-
108
-
109
-
110
-
111
-
112
-
113
-
114
-
115
-
116
-
117
-
118
-
119
-
120
-
121
-
122
-
123
-
124
-
125
-
126
-
127
-
128
-
129
-
130
-
131
-
132
-
133
-
134
-
135
-
136
-
137
-
138
-
139
-
140
-
141
-
142
-
143
-
144
-
145
-
146
-
147
-
148
-
149
-
150
-
151
-
152
-
153
-
154
-
155
-
156
-
157
-
158
-
159
-
160
-
161
-
162
-
163
-
164
-
165
-
166
-
167
-
168
-
169
-
170
-
171
-
172
-
173
-
174
-
175
-
176
-
177
-
178
-
179
-
180
-
181
-
182
-
183
-
184
-
185
-
186
-
187
-
188
-
189
-
190
-
191
-
192
-
193
-
194
-
195
-
196
-
197
-
198
-
199
-
200
-
201
-
202
-
203
-
204
-
205
-
206
-
207
-
208
-
209
-
210
-
211
-
212
-
213
-
214
-
215
-
216
-
217
-
218
-
219
-
220
-
221
-
222
-
223
-
224
-
225
-
226
-
227
-
228
-
229
-
230
-
231
-
232
-
233
-
234
-
235
-
236
-
237
-
238
-
239
-
240
-
241
-
242
-
243
-
244
-
245
-
246
-
247
-
248
-
249
-
250
-
251
-
252
-
253
-
254
-
255
-
256
-
257
-
258
-
259
-
260
-
261
-
262
-
263
-
264
-
265
-
266
-
267
-
268
-
269
-
270
-
271
-
272
-
273
-
274
-
275
-
276
-
277
-
278
-
279
-
280
-
281
-
282
-
283
-
284
-
285
-
286
-
287
-
288
-
289
-
290
-
291
-
292
-
293
-
294
-
295
-
296
-
297
-
298
-
299
-
300
-
301
-
302
-
303
 |
 |

with the US government at those premises. We
continue to work with the EPA to resolve
suspension and debarment issues.
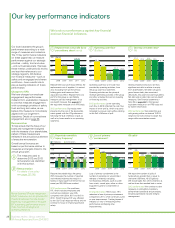
Value
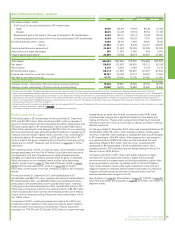
We achieved a profit of $11.6 billion in 2012
compared with $25.7 billion in 2011. Excluding
inventory holding gains, our replacement cost
(RC) profita in 2012 was $12.0 billion compared
with $23.9 billion in 2011. After adjusting for
non-operating items and fair value accounting
effectsb, our underlying RC profitb was $17.6
billion in 2012 compared with $21.7 billion in 2011.
Underlying RC profit is a measure closely tracked
by management to evaluate BP’s operating
performance and to make financial, strategic and
operating decisions.
Our goal is to grow operating cash flowc to
enable us to invest for future growth and
increase distributions to shareholders. This year
we generated operating cash flow of $20.4
billion, compared with $22.2 billion in 2011. The
cash outflow in respect of the Gulf of Mexico oil
spill reduced from $6.8 billion in 2011 to $2.4
billion in 2012. Cash and cash equivalents at the
end of 2012 totalled $19.5 billion. Gross debt at
31 December 2012 was $48.8 billion compared
with $44.2 billion at 31 December 2011. Net
debta was $27.5 billion at 31 December 2012,
leaving our gearing (net debt ratio)d at 18.7%
compared with 20.5% at the end of 2011. We
continue to target gearing in the 10-20% range
while uncertainties remain.
Dividends
Total dividends paid in 2012 were 33 cents per
share, up 18% compared with 2011 on a dollar
basis and 20% in sterling terms. This equated
to a total cash distribution to shareholders of
$5.3 billion during the year. We announced two
increases in the quarterly dividend during 2012
– by 14%, to 8 cents per share, in February and
by a further 12.5%, to 9 cents per share, in
October. These increases reflected our
confidence in the company’s progress against
the 10-point plan and our growing belief in its
longer-term prospects.
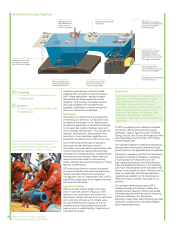
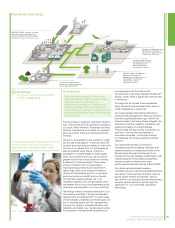
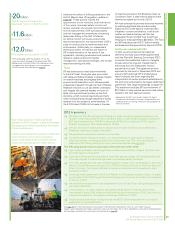
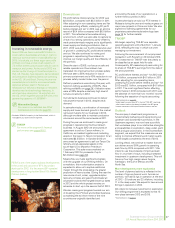
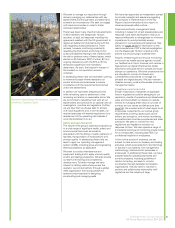
We made good progress on the Whiting refinery
modernization programme (right) in 2012, and the
project is on track to come onstream in the
second half of 2013.
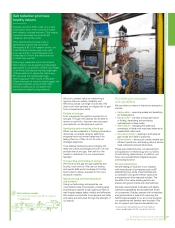
BP is accelerating the commercialization of
advanced biobutanol technology – with partner
Du Pont – at a purpose-built development and
demonstration facility at our Saltend site, near
Hull, UK (above).
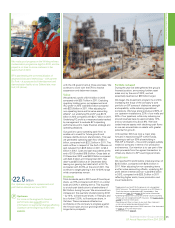
$22.5 billion
Our Upstream segment’s replacement cost
profit before interest and tax in 2012.
Upstream
For more on the segment’s financial
performance see page 65 and for
information on segmental changes affecting
Upstream at the beginning of 2012 see
page 64.
a
Replacement cost profit for the group is not a recognized
GAAP measure. The equivalent measure on an IFRS basis is
‘Profit for the year attributable to BP shareholders’. See
footnote b on page 34 and page 98 for further information.
b
Underlying replacement cost profit and fair value accounting
effects are not recognized GAAP measures. See pages 34, 37
and 98 for further information.
c
Operating cash flow is shown in our cash flow statement
as net cash provided by operating activities.
d
Net debt and gearing are non-GAAP measures. See footnote d
on page 21 for further information.
e
See footnote b on page 34.
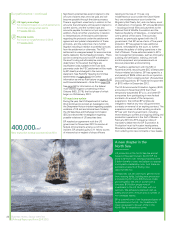
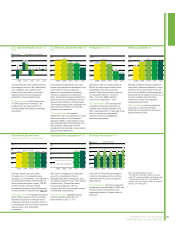
Portfolio reshaped
During the year we strengthened the group’s
financial position, announcing further asset
sales and, by the end of 2012, we had
essentially reached our $38 billion target.
We began the divestment programme in 2010,
increasing the focus of the company’s core
portfolio on BP’s areas of distinctive strength
and capability, while reducing operational
complexity. We have since sold around 50% of
our upstream installations, 32% of our wells and
50% of our pipelines, while only reducing our
proved reserves base by approximately 10%
and our production by about 9%. We have
traded mature assets with declining cash flows
so we can concentrate on assets with greater
potential for growth.
In November 2012 we took a major step
forward in repositioning BP within Russia,
agreeing to sell our 50% shareholding in
TNK-BP to Rosneft – the world’s largest publicly
traded oil company in terms of oil production
and reserves. Our intention is to use part of the
cash proceeds from the agreed transaction to
offset any dilution to BP’s earnings per share.
Upstream
We reported RC profit before interest and tax of
$22.5 billion, compared with $26.4 billion in
2011. After adjusting for non-operating items
and fair value accounting effects, underlying RC
profit before interest and taxe was $19.4 billion
in 2012, compared with $25.2 billion in 2011
reflecting higher costs, lower production and
lower realizations.
Business review: Group overview
BP Annual Report and Form 20-F 2012 25
Business review: Group overview