BP 2012 Annual Report Download - page 251
Download and view the complete annual report
Please find page 251 of the 2012 BP annual report below. You can navigate through the pages in the report by either clicking on the pages listed below, or by using the keyword search tool below to find specific information within the annual report.-
 1
1 -
2
-
3
-
4
-
5
-
6
-
7
-
8
-
9
-
10
-
11
-
12
-
13
-
14
-
15
-
16
-
17
-
18
-
19
-
20
-
21
-
22
-
23
-
24
-
25
-
26
-
27
-
28
-
29
-
30
-
31
-
32
-
33
-
34
-
35
-
36
-
37
-
38
-
39
-
40
-
41
-
42
-
43
-
44
-
45
-
46
-
47
-
48
-
49
-
50
-
51
-
52
-
53
-
54
-
55
-
56
-
57
-
58
-
59
-
60
-
61
-
62
-
63
-
64
-
65
-
66
-
67
-
68
-
69
-
70
-
71
-
72
-
73
-
74
-
75
-
76
-
77
-
78
-
79
-
80
-
81
-
82
-
83
-
84
-
85
-
86
-
87
-
88
-
89
-
90
-
91
-
92
-
93
-
94
-
95
-
96
-
97
-
98
-
99
-
100
-
101
-
102
-
103
-
104
-
105
-
106
-
107
-
108
-
109
-
110
-
111
-
112
-
113
-
114
-
115
-
116
-
117
-
118
-
119
-
120
-
121
-
122
-
123
-
124
-
125
-
126
-
127
-
128
-
129
-
130
-
131
-
132
-
133
-
134
-
135
-
136
-
137
-
138
-
139
-
140
-
141
-
142
-
143
-
144
-
145
-
146
-
147
-
148
-
149
-
150
-
151
-
152
-
153
-
154
-
155
-
156
-
157
-
158
-
159
-
160
-
161
-
162
-
163
-
164
-
165
-
166
-
167
-
168
-
169
-
170
-
171
-
172
-
173
-
174
-
175
-
176
-
177
-
178
-
179
-
180
-
181
-
182
-
183
-
184
-
185
-
186
-
187
-
188
-
189
-
190
-
191
-
192
-
193
-
194
-
195
-
196
-
197
-
198
-
199
-
200
-
201
-
202
-
203
-
204
-
205
-
206
-
207
-
208
-
209
-
210
-
211
-
212
-
213
-
214
-
215
-
216
-
217
-
218
-
219
-
220
-
221
-
222
-
223
-
224
-
225
-
226
-
227
-
228
-
229
-
230
-
231
-
232
-
233
-
234
-
235
-
236
-
237
-
238
-
239
-
240
-
 241
241 -
 242
242 -
 243
243 -
 244
244 -
 245
245 -
 246
246 -
 247
247 -
 248
248 -
 249
249 -
 250
250 -
 251
251 -
 252
252 -
 253
253 -
 254
254 -
 255
255 -
 256
256 -
 257
257 -
 258
258 -
 259
259 -
 260
260 -
 261
261 -
262
-
263
-
264
-
265
-
266
-
267
-
268
-
269
-
270
-
271
-
272
-
273
-
274
-
275
-
276
-
277
-
278
-
279
-
280
-
281
-
282
-
283
-
284
-
285
-
286
-
287
-
288
-
289
-
290
-
291
-
292
-
293
-
294
-
295
-
296
-
297
-
298
-
299
-
300
-
301
-
302
-
303
 |
 |

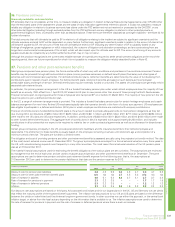
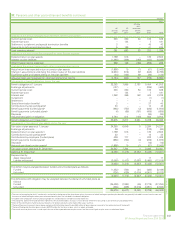
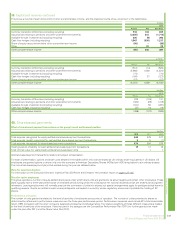
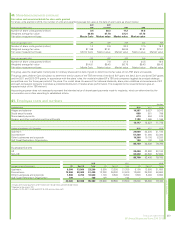
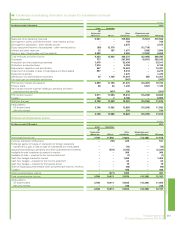
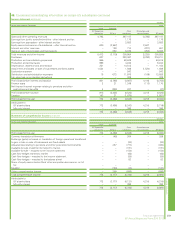
The pre-tax amounts of each component of other comprehensive income, and the related amounts of tax, are shown in the table below.
$ million
2012
Pre-tax Tax Net of tax
Currency translation differences (including recycling) 516 146 662
Actuarial loss relating to pensions and other post-retirement benefits (2,335) 616 (1,719)
Available-for-sale investments (including recycling) 305 (9) 296
Cash flow hedges (including recycling) 1,547 (330) 1,217
Share of equity-accounted entities’ other comprehensive income (98) – (98)
Other –23 23
Other comprehensive income (65) 446 381
$ million
2011
Pre-tax Tax Netoftax
Currency translation differences (including recycling) (512) (14) (526)
Actuarial loss relating to pensions and other post-retirement benefits (5,960) 1,636 (4,324)
Available-for-sale investments (including recycling) (74) – (74)
Cash flow hedges (including recycling) (164) 37 (127)
Share of equity-accounted entities’ other comprehensive income (57) – (57)
Other comprehensive income (6,767) 1,659 (5,108)
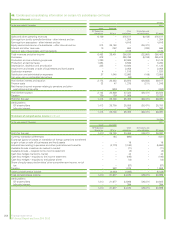
$ million
2010
Pre-tax Tax Netoftax
Currency translation differences (including recycling) 239 (108) 131
Actuarial loss relating to pensions and other post-retirement benefits (320) (98) (418)
Available-for-sale investments (including recycling) (341) 50 (291)
Cash flow hedges (including recycling) (37) 19 (18)
Other comprehensive income (459) (137) (596)
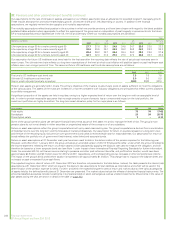
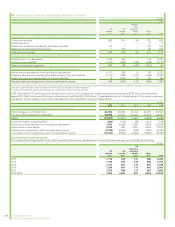
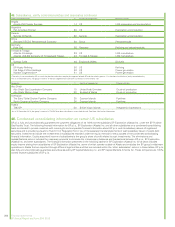
40. Share-based payments
Effect of share-based payment transactions on the group’s result and financial position
$ million
2012 2011 2010
Total expense recognized for equity-settled share-based payment transactions 669 579 577
Total expense (credit) recognized for cash-settled share-based payment transactions 55 (1)
Total expense recognized for share-based payment transactions 674 584 576
Closing balance of liability for cash-settled share-based payment transactions 12 12 16
Total intrinsic value for vested cash-settled share-based payments –11
All share-based payment transactions relate to employee compensation.
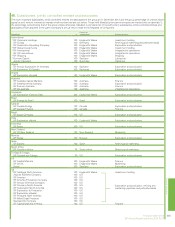
For ease of presentation, options and share units detailed in the tables within this note are stated as UK ordinary share equivalents in US dollars. US
employees are granted options or share units over the company’s American Depositary Shares (ADSs) (one ADS is equivalent to six ordinary shares).
The main share-based payment plans that existed during the year are detailed below.
Plans for executive directors
For information on the Executive Directors’ Incentive Plan (EDIP) see the Directors’ remuneration report on pages 127-145.
Plans for senior employees
The group operates a number of equity-settled share plans under which share units are granted to its senior leaders and certain other employees. These
plans typically have a three-year performance or restricted period during which the units accrue net notional dividends which are treated as having been
reinvested. Leaving employment will normally preclude the conversion of units into shares, but special arrangements apply for participants that leave for
qualifying reasons. Grants are settled in cash where participants are located in a country whose regulatory environment prohibits the holding of BP
shares.
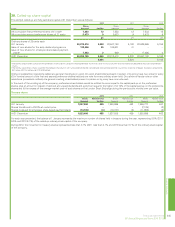
Performance unit plans
The number of units granted is related to the level of seniority of employees and country of operation. The number of units converted to shares is
determined by reference to performance measures over the three-year performance period. Performance measures used include BP’s total shareholder
return (TSR) compared with the other oil majors, balanced scorecard and individual rating. The relative weighting of these different measures is related
to the level of seniority of the employee. Plans included in this category are the Competitive Performance Plan (CPP) (no further grants to be made
under this plan after 2011) and the Share Value Plan (SVP).
Financial statements 249
BP Annual Report and Form 20-F 2012
Financial statements
39. Capital and reserves continued