BP 2012 Annual Report Download - page 266
Download and view the complete annual report
Please find page 266 of the 2012 BP annual report below. You can navigate through the pages in the report by either clicking on the pages listed below, or by using the keyword search tool below to find specific information within the annual report.-
 1
1 -
2
-
3
-
4
-
5
-
6
-
7
-
8
-
9
-
10
-
11
-
12
-
13
-
14
-
15
-
16
-
17
-
18
-
19
-
20
-
21
-
22
-
23
-
24
-
25
-
26
-
27
-
28
-
29
-
30
-
31
-
32
-
33
-
34
-
35
-
36
-
37
-
38
-
39
-
40
-
41
-
42
-
43
-
44
-
45
-
46
-
47
-
48
-
49
-
50
-
51
-
52
-
53
-
54
-
55
-
56
-
57
-
58
-
59
-
60
-
61
-
62
-
63
-
64
-
65
-
66
-
67
-
68
-
69
-
70
-
71
-
72
-
73
-
74
-
75
-
76
-
77
-
78
-
79
-
80
-
81
-
82
-
83
-
84
-
85
-
86
-
87
-
88
-
89
-
90
-
91
-
92
-
93
-
94
-
95
-
96
-
97
-
98
-
99
-
100
-
101
-
102
-
103
-
104
-
105
-
106
-
107
-
108
-
109
-
110
-
111
-
112
-
113
-
114
-
115
-
116
-
117
-
118
-
119
-
120
-
121
-
122
-
123
-
124
-
125
-
126
-
127
-
128
-
129
-
130
-
131
-
132
-
133
-
134
-
135
-
136
-
137
-
138
-
139
-
140
-
141
-
142
-
143
-
144
-
145
-
146
-
147
-
148
-
149
-
150
-
151
-
152
-
153
-
154
-
155
-
156
-
157
-
158
-
159
-
160
-
161
-
162
-
163
-
164
-
165
-
166
-
167
-
168
-
169
-
170
-
171
-
172
-
173
-
174
-
175
-
176
-
177
-
178
-
179
-
180
-
181
-
182
-
183
-
184
-
185
-
186
-
187
-
188
-
189
-
190
-
191
-
192
-
193
-
194
-
195
-
196
-
197
-
198
-
199
-
200
-
201
-
202
-
203
-
204
-
205
-
206
-
207
-
208
-
209
-
210
-
211
-
212
-
213
-
214
-
215
-
216
-
217
-
218
-
219
-
220
-
221
-
222
-
223
-
224
-
225
-
226
-
227
-
228
-
229
-
230
-
231
-
232
-
233
-
234
-
235
-
236
-
237
-
238
-
239
-
240
-
241
-
242
-
243
-
244
-
245
-
246
-
247
-
248
-
249
-
250
-
251
-
252
-
253
-
254
-
255
-
 256
256 -
 257
257 -
 258
258 -
 259
259 -
 260
260 -
 261
261 -
 262
262 -
 263
263 -
 264
264 -
 265
265 -
 266
266 -
 267
267 -
 268
268 -
 269
269 -
 270
270 -
 271
271 -
 272
272 -
 273
273 -
 274
274 -
 275
275 -
 276
276 -
277
-
278
-
279
-
280
-
281
-
282
-
283
-
284
-
285
-
286
-
287
-
288
-
289
-
290
-
291
-
292
-
293
-
294
-
295
-
296
-
297
-
298
-
299
-
300
-
301
-
302
-
303
 |
 |

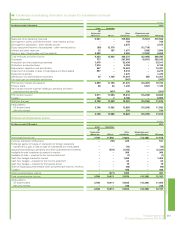
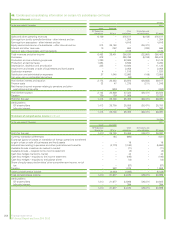
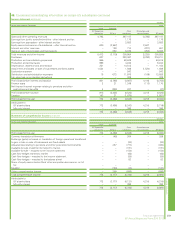
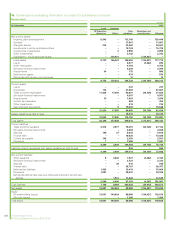
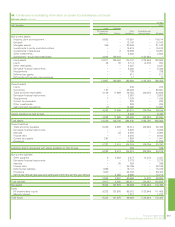
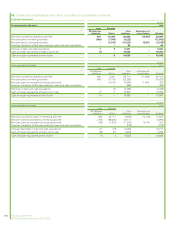
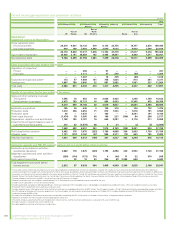
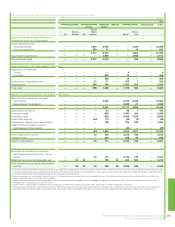
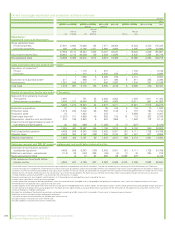
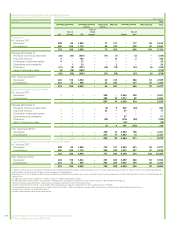
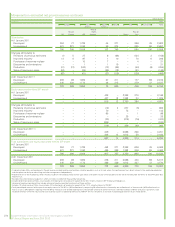
Oil and natural gas exploration and production activities
$ million
2012
Europe North
America
South
America
Africa Asia Australasia Total
UK
Rest of
Europe US
Rest of
North
America Russia
Rest of
Asia
Subsidiariesa
Capitalized costs at 31 Decemberbj
Gross capitalized costs
Proved properties 28,370 9,421 70,133 219 8,153 32,755 — 16,757 3,676 169,484
Unproved properties 400 199 7,084 1,659 3,590 4,524 — 4,920 1,540 23,916
28,770 9,620 77,217 1,878 11,743 37,279 — 21,677 5,216 193,400
Accumulated depreciation 19,002 3,161 35,459 197 4,444 16,901 — 8,360 1,517 89,041
Net capitalized costs 9,768 6,459 41,758 1,681 7,299 20,378 — 13,317 3,699 104,359
Costs incurred for the year ended 31 Decemberb
Acquisition of propertiesck
Proved — — 256 — 51 — — — — 307
Unproved — — 1,111 — 27 239 — (68) — 1,309
— — 1,367 — 78 239 — (68) — 1,616
Exploration and appraisal costsd173 47 1,069 191 758 1,024 — 814 241 4,317
Development 1,907 784 3,866 22 581 2,992 — 1,591 221 11,964
Total costs 2,080 831 6,302 213 1,417 4,255 — 2,337 462 17,897
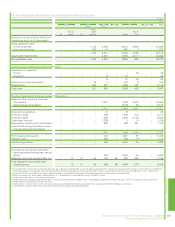
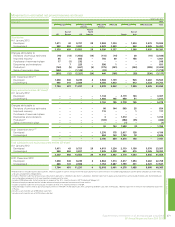
Results of operations for the year ended 31 December
Sales and other operating revenuese
Third parties 1,595 76 453 10 2,026 3,424 — 1,299 1,749 10,632
Sales between businesses 2,975 783 15,713 10 984 5,633 — 11,345 915 38,358
4,570 859 16,166 20 3,010 9,057 — 12,644 2,664 48,990
Exploration expenditure 105 29 649 4 120 310 — 126 132 1,475
Production costs 1,310 348 3,854 71 812 1,323 — 1,076 191 8,985
Production taxes 92 — 1,472 — 162 — — 6,291 141 8,158
Other costs (income)f(1,474) 78 3,505 60 109 221 (330) 84 264 2,517
Depreciation, depletion and amortization 1,102 145 3,187 10 606 2,281 — 2,116 211 9,658
Impairments and (gains) losses on sale of
businesses and fixed assets 373 83 (3,576) 98 6 24 — (2) (5) (2,999)
1,508 683 9,091 243 1,815 4,159 (330) 9,691 934 27,794
Profit (loss) before taxationg3,062 176 7,075 (223) 1,195 4,898 330 2,953 1,730 21,196
Allocable taxes 1,121 (313) 2,762 (67) 804 2,371 (13) 663 755 8,083
Results of operations 1,941 489 4,313 (156) 391 2,527 343 2,290 975 13,113
Upstream segment and TNK-BP segment replacement cost profit before interest and tax
Exploration and production activities –
subsidiaries (as above) 3,062 176 7,075 (223) 1,195 4,898 330 2,953 1,730 21,196
Midstream activities and other activities –
subsidiariesh(250) (114) (173) 774 4 (46) 11 32 370 608
Equity-accounted entitiesi— 35 16 43 256 48 3,005 640 — 4,043
Total replacement cost profit before
interest and tax 2,812 97 6,918 594 1,455 4,900 3,346 3,625 2,100 25,847
aThese tables contain information relating to oil and natural gas exploration and production activities of subsidiaries. They do not include any costs relating to the Gulf of Mexico oil spill. Midstream
activities relating to the management and ownership of crude oil and natural gas pipelines, processing and export terminals and LNG processing facilities and transportation are excluded. In addition, our
midstream activities of marketing and trading of natural gas, power and NGLs in the US, Canada, UK and Europe are excluded. The most significant midstream pipeline interests include the Trans-Alaska
Pipeline System, the Forties Pipeline System, the Central Area Transmission System pipeline, the South Caucasus Pipeline and the Baku-Tbilisi-Ceyhan pipeline. Major LNG activities are located in
Trinidad, Indonesia and Australia and BP is also investing in the LNG business in Angola.
bDecommissioning assets are included in capitalized costs at 31 December but are excluded from costs incurred for the year.
cIncludes costs capitalized as a result of asset exchanges.
dIncludes exploration and appraisal drilling expenditures, which are capitalized within intangible assets, and geological and geophysical exploration costs, which are charged to income as incurred.
ePresented net of transportation costs, purchases and sales taxes.
fIncludes property taxes, other government take and the fair value gain on embedded derivatives of $347 million. The UK region includes a $1,161 million gain offset by corresponding charges primarily in
the US, relating to the group self-insurance programme. The Russia region, for which equity accounting ceased on 22 October 2012, includes dividend income of $709 million partly offset by a
settlement charge of $325 million.
gExcludes the unwinding of the discount on provisions and payables amounting to $227 million which is included in finance costs in the group income statement.
hMidstream and other activities exclude inventory holding gains and losses.
iThe profits of equity-accounted entities are included after interest and tax and the results exclude balances associated with assets held for sale.
jExcludes balances associated with assets held for sale.
kExcludes goodwill associated with business combinations.
264 Supplementary information on oil and natural gas (unaudited)
BP Annual Report and Form 20-F 2012