BP 2012 Annual Report Download - page 22
Download and view the complete annual report
Please find page 22 of the 2012 BP annual report below. You can navigate through the pages in the report by either clicking on the pages listed below, or by using the keyword search tool below to find specific information within the annual report.-
 1
1 -
2
-
3
-
4
-
5
-
6
-
7
-
8
-
9
-
10
-
11
-
 12
12 -
 13
13 -
 14
14 -
 15
15 -
 16
16 -
 17
17 -
 18
18 -
 19
19 -
 20
20 -
 21
21 -
 22
22 -
 23
23 -
 24
24 -
 25
25 -
 26
26 -
 27
27 -
 28
28 -
 29
29 -
 30
30 -
 31
31 -
 32
32 -
33
-
34
-
35
-
36
-
37
-
38
-
39
-
40
-
41
-
42
-
43
-
44
-
45
-
46
-
47
-
48
-
49
-
50
-
51
-
52
-
53
-
54
-
55
-
56
-
57
-
58
-
59
-
60
-
61
-
62
-
63
-
64
-
65
-
66
-
67
-
68
-
69
-
70
-
71
-
72
-
73
-
74
-
75
-
76
-
77
-
78
-
79
-
80
-
81
-
82
-
83
-
84
-
85
-
86
-
87
-
88
-
89
-
90
-
91
-
92
-
93
-
94
-
95
-
96
-
97
-
98
-
99
-
100
-
101
-
102
-
103
-
104
-
105
-
106
-
107
-
108
-
109
-
110
-
111
-
112
-
113
-
114
-
115
-
116
-
117
-
118
-
119
-
120
-
121
-
122
-
123
-
124
-
125
-
126
-
127
-
128
-
129
-
130
-
131
-
132
-
133
-
134
-
135
-
136
-
137
-
138
-
139
-
140
-
141
-
142
-
143
-
144
-
145
-
146
-
147
-
148
-
149
-
150
-
151
-
152
-
153
-
154
-
155
-
156
-
157
-
158
-
159
-
160
-
161
-
162
-
163
-
164
-
165
-
166
-
167
-
168
-
169
-
170
-
171
-
172
-
173
-
174
-
175
-
176
-
177
-
178
-
179
-
180
-
181
-
182
-
183
-
184
-
185
-
186
-
187
-
188
-
189
-
190
-
191
-
192
-
193
-
194
-
195
-
196
-
197
-
198
-
199
-
200
-
201
-
202
-
203
-
204
-
205
-
206
-
207
-
208
-
209
-
210
-
211
-
212
-
213
-
214
-
215
-
216
-
217
-
218
-
219
-
220
-
221
-
222
-
223
-
224
-
225
-
226
-
227
-
228
-
229
-
230
-
231
-
232
-
233
-
234
-
235
-
236
-
237
-
238
-
239
-
240
-
241
-
242
-
243
-
244
-
245
-
246
-
247
-
248
-
249
-
250
-
251
-
252
-
253
-
254
-
255
-
256
-
257
-
258
-
259
-
260
-
261
-
262
-
263
-
264
-
265
-
266
-
267
-
268
-
269
-
270
-
271
-
272
-
273
-
274
-
275
-
276
-
277
-
278
-
279
-
280
-
281
-
282
-
283
-
284
-
285
-
286
-
287
-
288
-
289
-
290
-
291
-
292
-
293
-
294
-
295
-
296
-
297
-
298
-
299
-
300
-
301
-
302
-
303
 |
 |

Our strategy
In 2011 we put forward a 10-point plan that
outlined what could be expected from BP over
the next three years. During 2012 we worked
towards the milestones we had set out for
2014. We refined our plans and communicated
further information on our longer-term
strategic objectives beyond 2014.
Through this work and the actions taken to
strengthen the group, BP enters 2013 a more
focused oil and gas company with promising
opportunities and a clear plan for the future.
BP’s strengthened position, distinctive
capabilities, strong financial framework and
vision for the future provide the foundation
for our long-term strategy. This strategy is
intended to ensure BP is well positioned for
the world we see ahead.
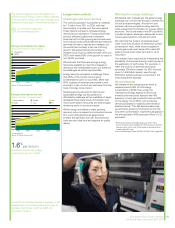
Our financial framework
We expect our organic capital expenditurea
to be in the range of $24-27 billion per year
through to the end of the decade, with
investment prioritized towards the Upstream
segment. All investments will continue to be
subject to a rigorous capital allocation review
process.
We expect to make around $2-3 billion of
divestments per year in order to constantly
optimize our portfolio. We will target gearingb
in the 10-20% range while uncertainties
remain. Our intention is to increase
shareholder distributions in line with BP’s
improving circumstances.
Our strategic priorities
Our aim is to be an oil and gas company
that grows over the long term. We will seek
to continually enhance safety and risk
management, earn and keep people’s trust,
and create value for shareholders. We will
continue to simplify our organization and fine
tune the portfolio. We will focus on efficient
execution in our operations and our use of
capital. We will build capability through the
pursuit of greater standardization and
increased functional expertise.
BP Energy Outlook 2030 projects that world
demand for energy will continue to grow. In
helping to meet this demand, BP has a large
suite of opportunities – the legacy of years of
success in gaining access to and developing
resources. This allows us to select and invest
in those projects with the potential to provide
the highest returns. We will prioritize value
rather than seek to grow production volume
for its own sake. We will concentrate on
higher quality assets in both our Upstream and
Downstream segments, starting with safety
and the delivery of strong and growing cash
flows to the group.
a Organic capital expenditure excludes acquisitions and asset
exchanges.
b See footnote d on page 21.
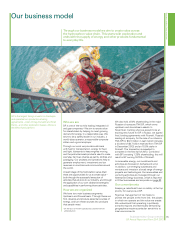
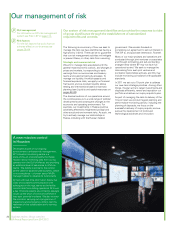
Through our strategy we aim to create a distinctive platform
for value growth over the long term.
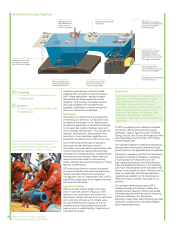
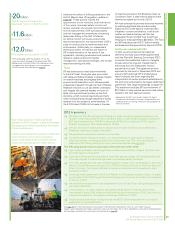
Our seismic technology helps minimize field
appraisal and development risk. The above
model of a hydrocarbon field in the Gulf of
Mexico shows large salt deposits obscuring
a hydrocarbon reservoir.
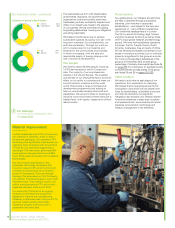
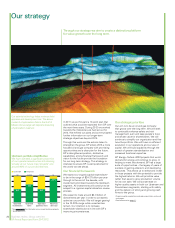
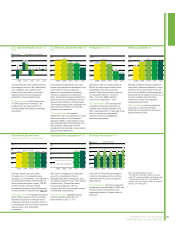
Upstream portfolio simplification
50%
110 20,000 18,000 13
68%
50%
~90%
Operated
installations
Operated
wells
Operated
pipelines (km)
Reserves
(bn boe)
We have divested a significant proportion
of our operated assets while still retaining
virtually all our future major projectsa and
around 90% of our proved reserves.
a See pages 67-71 for information on our major Upstream projects.
b Since April 2010.
DivestedbRetained
Business review: Group overview
BP Annual Report and Form 20-F 2012
20