BP 2012 Annual Report Download - page 218
Download and view the complete annual report
Please find page 218 of the 2012 BP annual report below. You can navigate through the pages in the report by either clicking on the pages listed below, or by using the keyword search tool below to find specific information within the annual report.-
 1
1 -
2
-
3
-
4
-
5
-
6
-
7
-
8
-
9
-
10
-
11
-
12
-
13
-
14
-
15
-
16
-
17
-
18
-
19
-
20
-
21
-
22
-
23
-
24
-
25
-
26
-
27
-
28
-
29
-
30
-
31
-
32
-
33
-
34
-
35
-
36
-
37
-
38
-
39
-
40
-
41
-
42
-
43
-
44
-
45
-
46
-
47
-
48
-
49
-
50
-
51
-
52
-
53
-
54
-
55
-
56
-
57
-
58
-
59
-
60
-
61
-
62
-
63
-
64
-
65
-
66
-
67
-
68
-
69
-
70
-
71
-
72
-
73
-
74
-
75
-
76
-
77
-
78
-
79
-
80
-
81
-
82
-
83
-
84
-
85
-
86
-
87
-
88
-
89
-
90
-
91
-
92
-
93
-
94
-
95
-
96
-
97
-
98
-
99
-
100
-
101
-
102
-
103
-
104
-
105
-
106
-
107
-
108
-
109
-
110
-
111
-
112
-
113
-
114
-
115
-
116
-
117
-
118
-
119
-
120
-
121
-
122
-
123
-
124
-
125
-
126
-
127
-
128
-
129
-
130
-
131
-
132
-
133
-
134
-
135
-
136
-
137
-
138
-
139
-
140
-
141
-
142
-
143
-
144
-
145
-
146
-
147
-
148
-
149
-
150
-
151
-
152
-
153
-
154
-
155
-
156
-
157
-
158
-
159
-
160
-
161
-
162
-
163
-
164
-
165
-
166
-
167
-
168
-
169
-
170
-
171
-
172
-
173
-
174
-
175
-
176
-
177
-
178
-
179
-
180
-
181
-
182
-
183
-
184
-
185
-
186
-
187
-
188
-
189
-
190
-
191
-
192
-
193
-
194
-
195
-
196
-
197
-
198
-
199
-
200
-
201
-
202
-
203
-
204
-
205
-
206
-
207
-
 208
208 -
 209
209 -
 210
210 -
 211
211 -
 212
212 -
 213
213 -
 214
214 -
 215
215 -
 216
216 -
 217
217 -
 218
218 -
 219
219 -
 220
220 -
 221
221 -
 222
222 -
 223
223 -
 224
224 -
 225
225 -
 226
226 -
 227
227 -
 228
228 -
229
-
230
-
231
-
232
-
233
-
234
-
235
-
236
-
237
-
238
-
239
-
240
-
241
-
242
-
243
-
244
-
245
-
246
-
247
-
248
-
249
-
250
-
251
-
252
-
253
-
254
-
255
-
256
-
257
-
258
-
259
-
260
-
261
-
262
-
263
-
264
-
265
-
266
-
267
-
268
-
269
-
270
-
271
-
272
-
273
-
274
-
275
-
276
-
277
-
278
-
279
-
280
-
281
-
282
-
283
-
284
-
285
-
286
-
287
-
288
-
289
-
290
-
291
-
292
-
293
-
294
-
295
-
296
-
297
-
298
-
299
-
300
-
301
-
302
-
303
 |
 |

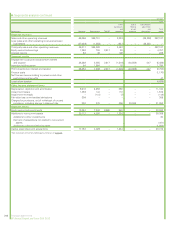
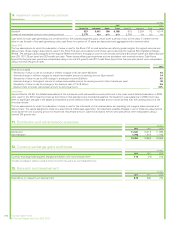
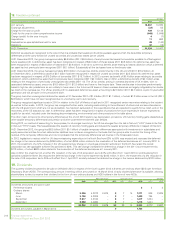
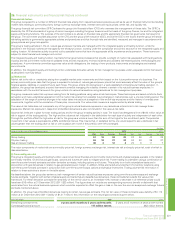
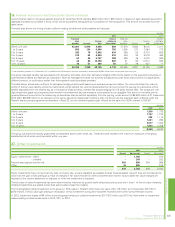
21. Property, plant and equipment
$ million
Land
and land
improvements Buildings
Oil and
gas
properties
Plant,
machinery
and
equipment
Fixtures,
fittings and
office
equipment Transportation
Oil depots,
storage
tanks and
service
stations Total
Cost
At 1 January 2012 3,099 2,846 175,874 35,709 3,095 12,753 8,611 241,987
Exchange adjustments 73 12 – 229 29 8 272 623
Additions 120 387 15,709 4,248 312 902 533 22,211
Acquisitions – – 44 2 – 15 – 61
Transfers – – 1,306 – – – – 1,306
Reclassified as assets held for sale – – (19,410) (143) – (172) (2) (19,727)
Deletions (96) (532) (3,460) (758) (135) (70) (355) (5,406)
At 31 December 2012 3,196 2,713 170,063 39,287 3,301 13,436 9,059 241,055
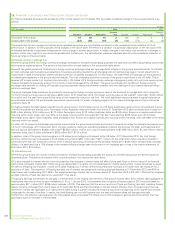
Depreciation
At 1 January 2012 510 1,372 91,994 14,266 1,911 8,149 4,571 122,773
Exchange adjustments 8 12 – 165 24 6 151 366
Charge for the year 33 122 9,658 1,242 286 320 504 12,165
Impairment losses 8 – 2,765 493 – 70 7 3,343
Impairment reversals – – (221) – – – (1) (222)
Reclassified as assets held for sale – – (13,774) (36) – (126) (2) (13,938)
Deletions (46) (524) (2,457) (394) (134) (10) (315) (3,880)
At 31 December 2012 513 982 87,965 15,736 2,087 8,409 4,915 120,607
Net book amount at 31 December 2012 2,683 1,731 82,098 23,551 1,214 5,027 4,144 120,448
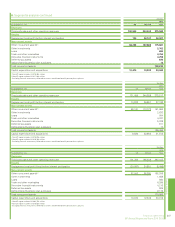
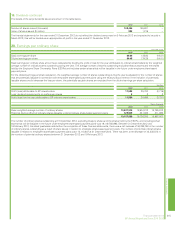
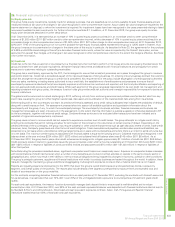
Cost
At 1 January 2011 3,560 2,835 160,184 42,827 2,965 12,216 9,652 234,239
Exchange adjustments (73) (73) – (294) (35) (12) (225) (712)
Additions 39 46 18,515 3,782 370 655 512 23,919
Acquisitions 62 134 2,100 567 4 – – 2,867
Transfers – – 1,013 – – – – 1,013
Reclassified as assets held for sale (325) – (832) (9,931) – – – (11,088)
Deletions (164) (96) (5,106) (1,242) (209) (106) (1,328) (8,251)
At 31 December 2011 3,099 2,846 175,874 35,709 3,095 12,753 8,611 241,987
Depreciation
At 1 January 2011 572 1,384 88,047 19,183 1,876 7,940 5,074 124,076
Exchange adjustments (10) (36) – (108) (34) (6) (113) (307)
Charge for the year 36 111 8,116 1,411 278 252 567 10,771
Impairment losses 133 4 1,239 245 – 42 46 1,709
Impairment reversals – – (146) – – – – (146)
Reclassified as assets held for sale (115) – (680) (5,761) – – – (6,556)
Deletions (106) (91) (4,582) (704) (209) (79) (1,003) (6,774)
At 31 December 2011 510 1,372 91,994 14,266 1,911 8,149 4,571 122,773
Net book amount at 31 December 2011 2,589 1,474 83,880 21,443 1,184 4,604 4,040 119,214
Net book amount at 1 January 2011 2,988 1,451 72,137 23,644 1,089 4,276 4,578 110,163
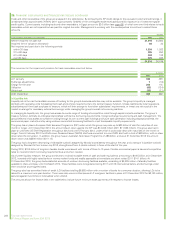
Assets held under finance leases at net book amount
included above
At 31 December 2012 – 9 157 254 – 9 – 429
At 31 December 2011 –10 213 326 – 7 18 574
Assets under construction included above
At 31 December 2012 27,308
At 31 December 2011 26,443
216 Financial statements
BP Annual Report and Form 20-F 2012