BP 2012 Annual Report Download - page 234
Download and view the complete annual report
Please find page 234 of the 2012 BP annual report below. You can navigate through the pages in the report by either clicking on the pages listed below, or by using the keyword search tool below to find specific information within the annual report.-
 1
1 -
2
-
3
-
4
-
5
-
6
-
7
-
8
-
9
-
10
-
11
-
12
-
13
-
14
-
15
-
16
-
17
-
18
-
19
-
20
-
21
-
22
-
23
-
24
-
25
-
26
-
27
-
28
-
29
-
30
-
31
-
32
-
33
-
34
-
35
-
36
-
37
-
38
-
39
-
40
-
41
-
42
-
43
-
44
-
45
-
46
-
47
-
48
-
49
-
50
-
51
-
52
-
53
-
54
-
55
-
56
-
57
-
58
-
59
-
60
-
61
-
62
-
63
-
64
-
65
-
66
-
67
-
68
-
69
-
70
-
71
-
72
-
73
-
74
-
75
-
76
-
77
-
78
-
79
-
80
-
81
-
82
-
83
-
84
-
85
-
86
-
87
-
88
-
89
-
90
-
91
-
92
-
93
-
94
-
95
-
96
-
97
-
98
-
99
-
100
-
101
-
102
-
103
-
104
-
105
-
106
-
107
-
108
-
109
-
110
-
111
-
112
-
113
-
114
-
115
-
116
-
117
-
118
-
119
-
120
-
121
-
122
-
123
-
124
-
125
-
126
-
127
-
128
-
129
-
130
-
131
-
132
-
133
-
134
-
135
-
136
-
137
-
138
-
139
-
140
-
141
-
142
-
143
-
144
-
145
-
146
-
147
-
148
-
149
-
150
-
151
-
152
-
153
-
154
-
155
-
156
-
157
-
158
-
159
-
160
-
161
-
162
-
163
-
164
-
165
-
166
-
167
-
168
-
169
-
170
-
171
-
172
-
173
-
174
-
175
-
176
-
177
-
178
-
179
-
180
-
181
-
182
-
183
-
184
-
185
-
186
-
187
-
188
-
189
-
190
-
191
-
192
-
193
-
194
-
195
-
196
-
197
-
198
-
199
-
200
-
201
-
202
-
203
-
204
-
205
-
206
-
207
-
208
-
209
-
210
-
211
-
212
-
213
-
214
-
215
-
216
-
217
-
218
-
219
-
220
-
221
-
222
-
223
-
 224
224 -
 225
225 -
 226
226 -
 227
227 -
 228
228 -
 229
229 -
 230
230 -
 231
231 -
 232
232 -
 233
233 -
 234
234 -
 235
235 -
 236
236 -
 237
237 -
 238
238 -
 239
239 -
 240
240 -
 241
241 -
 242
242 -
 243
243 -
 244
244 -
245
-
246
-
247
-
248
-
249
-
250
-
251
-
252
-
253
-
254
-
255
-
256
-
257
-
258
-
259
-
260
-
261
-
262
-
263
-
264
-
265
-
266
-
267
-
268
-
269
-
270
-
271
-
272
-
273
-
274
-
275
-
276
-
277
-
278
-
279
-
280
-
281
-
282
-
283
-
284
-
285
-
286
-
287
-
288
-
289
-
290
-
291
-
292
-
293
-
294
-
295
-
296
-
297
-
298
-
299
-
300
-
301
-
302
-
303
 |
 |

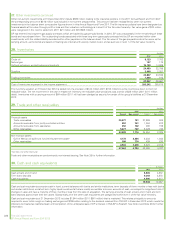
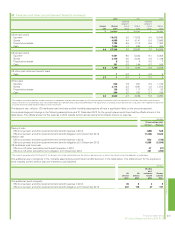
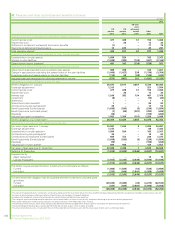
33. Derivative financial instruments continued
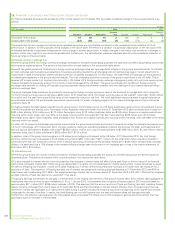
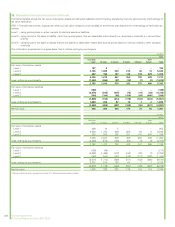
Embedded derivative liabilities relate mainly to commodity price contracts and have the following fair values and maturities.
$ million
2012
Less than
1 year 1-2 years 2-3 years 3-4 years 4-5 years
Over
5 years Total
Net fair value (322) (299) (252) (151) (57) (31) (1,112)
$ million
2011
Less than
1 year 1-2 years 2-3 years 3-4 years 4-5 years
Over
5 years Total
Net fair value (347) (319) (306) (236) (134) (75) (1,417)
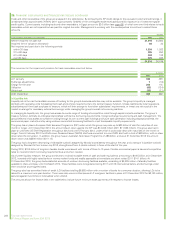
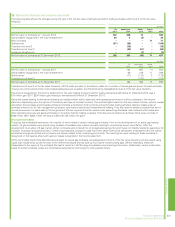
The following table shows the changes during the year in the net fair value of embedded derivatives, within level 3 of the fair value hierarchy.
$ million
2012 2011
Commodity
price
Commodity
price
Net fair value of contracts at 1 January (1,417) (1,607)
Settlements 375 301
Losses recognized in the income statement (6) (106)
Exchange adjustments (64) (5)
Net fair value of contracts at 31 December (1,112) (1,417)
The amount recognized in the income statement for the year relating to level 3 embedded derivatives still held at 31 December 2012 was a loss of $6
million (2011 $106 million loss relating to embedded derivatives still held at 31 December 2011).
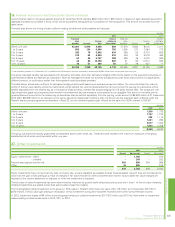
The fair value gain (loss) on embedded derivatives is shown below.
$ million
2012 2011 2010
Commodity price embedded derivatives 347 190 (309)
Other embedded derivatives –(122) –
Fair value gain (loss) 347 68 (309)
Cash flow hedges
At 31 December 2012, the group held currency forwards and futures contracts and cylinders that were being used to hedge the foreign currency risk of
highly probable forecast transactions, categorized in level 2 of the fair value hierarchy. Note 26 outlines the management of risk aspects for currency
risk. For cash flow hedges the group only claims hedge accounting for the intrinsic value on the currency with any fair value attributable to time value
taken immediately to the income statement. There were no highly probable transactions for which hedge accounting has been claimed that have not
occurred and no significant element of hedge ineffectiveness requiring recognition in the income statement. For cash flow hedges the pre-tax amount
removed from equity during the period and included in the income statement is a loss of $62 million (2011 $195 million gain and 2010 $25 million gain).
The entire loss of $62 million is included in production and manufacturing expenses (2011 $195 million gain in production and manufacturing expenses;
2010 $25 million gain in production and manufacturing expenses). The amount removed from equity during the period and included in the carrying
amount of non-financial assets was a loss of $19 million (2011 $13 million gain and 2010 $53 million loss). The amounts retained in equity at
31 December 2012 in relation to these cash flow hedges consist of deferred losses of $18 million maturing in 2013 and deferred gains of $9 million
maturing in 2015 and beyond.
The anticipated transaction whereby BP expects to sell its 50% interest in TNK-BP and acquire 18.5% of Rosneft, as described in Note 4, comprises
three agreements which, during the period from signing until completion, represent derivative financial instruments that are required to be measured at
fair value. BP has designated two of the agreements, for the acquisition of a 5.66% shareholding in Rosneft from Rosneftegaz, and for the acquisition of
a 9.80% shareholding from Rosneft, as hedging instruments in a cash flow hedge, and so changes in the fair values of these agreements are recognized
in other comprehensive income. The third agreement, under which BP expects to sell its 50% interest in TNK-BP in exchange for cash and a 3.04%
shareholding in Rosneft, is also a derivative financial instrument, but its fair value cannot be reliably measured. An asset of $1,410 million relatedto
these agreements was recognized on the balance sheet at 31 December 2012, of which $1,339 million relates to the fair value of the cash flow hedge
derivatives. The derivatives measured at fair value at 31 December 2012 are categorized in level 3 of the fair value hierarchy using inputs that includethe
quoted Rosneft share price. A credit of $1,410 million recognized in other comprehensive income would be recycled to the income statement only if the
investment in Rosneft is sold or impaired.
Fair value hedges
At 31 December 2012, the group held interest rate and cross-currency interest rate swap contracts as fair value hedges of the interest rate risk on fixed
rate debt issued by the group, categorized in level 2 of the fair value hierarchy. The effectiveness of each hedge relationship is quantitatively assessed
and demonstrated to continue to be highly effective. The gain on the hedging derivative instruments taken to the income statement in 2012 was $536
million (2011 $328 million and 2010 $563 million) offset by a loss on the fair value of the finance debt of $537 million (2011 $327 million and 2010 $554
million).
The interest rate and cross-currency interest rate swaps mature within one to 10 years, with an average maturity of four to five years (2011 four to five
years) and are used to convert sterling, euro, Swiss franc, Australian dollar, Japanese yen and Hong Kong dollar denominated borrowings into US dollar
floating rate debt. Note 26 outlines the group’s approach to interest rate and currency risk management.
232 Financial statements
BP Annual Report and Form 20-F 2012