BP 2012 Annual Report Download - page 87
Download and view the complete annual report
Please find page 87 of the 2012 BP annual report below. You can navigate through the pages in the report by either clicking on the pages listed below, or by using the keyword search tool below to find specific information within the annual report.-
 1
1 -
2
-
3
-
4
-
5
-
6
-
7
-
8
-
9
-
10
-
11
-
12
-
13
-
14
-
15
-
16
-
17
-
18
-
19
-
20
-
21
-
22
-
23
-
24
-
25
-
26
-
27
-
28
-
29
-
30
-
31
-
32
-
33
-
34
-
35
-
36
-
37
-
38
-
39
-
40
-
41
-
42
-
43
-
44
-
45
-
46
-
47
-
48
-
49
-
50
-
51
-
52
-
53
-
54
-
55
-
56
-
57
-
58
-
59
-
60
-
61
-
62
-
63
-
64
-
65
-
66
-
67
-
68
-
69
-
70
-
71
-
72
-
73
-
74
-
75
-
76
-
 77
77 -
 78
78 -
 79
79 -
 80
80 -
 81
81 -
 82
82 -
 83
83 -
 84
84 -
 85
85 -
 86
86 -
 87
87 -
 88
88 -
 89
89 -
 90
90 -
 91
91 -
 92
92 -
 93
93 -
 94
94 -
 95
95 -
 96
96 -
 97
97 -
98
-
99
-
100
-
101
-
102
-
103
-
104
-
105
-
106
-
107
-
108
-
109
-
110
-
111
-
112
-
113
-
114
-
115
-
116
-
117
-
118
-
119
-
120
-
121
-
122
-
123
-
124
-
125
-
126
-
127
-
128
-
129
-
130
-
131
-
132
-
133
-
134
-
135
-
136
-
137
-
138
-
139
-
140
-
141
-
142
-
143
-
144
-
145
-
146
-
147
-
148
-
149
-
150
-
151
-
152
-
153
-
154
-
155
-
156
-
157
-
158
-
159
-
160
-
161
-
162
-
163
-
164
-
165
-
166
-
167
-
168
-
169
-
170
-
171
-
172
-
173
-
174
-
175
-
176
-
177
-
178
-
179
-
180
-
181
-
182
-
183
-
184
-
185
-
186
-
187
-
188
-
189
-
190
-
191
-
192
-
193
-
194
-
195
-
196
-
197
-
198
-
199
-
200
-
201
-
202
-
203
-
204
-
205
-
206
-
207
-
208
-
209
-
210
-
211
-
212
-
213
-
214
-
215
-
216
-
217
-
218
-
219
-
220
-
221
-
222
-
223
-
224
-
225
-
226
-
227
-
228
-
229
-
230
-
231
-
232
-
233
-
234
-
235
-
236
-
237
-
238
-
239
-
240
-
241
-
242
-
243
-
244
-
245
-
246
-
247
-
248
-
249
-
250
-
251
-
252
-
253
-
254
-
255
-
256
-
257
-
258
-
259
-
260
-
261
-
262
-
263
-
264
-
265
-
266
-
267
-
268
-
269
-
270
-
271
-
272
-
273
-
274
-
275
-
276
-
277
-
278
-
279
-
280
-
281
-
282
-
283
-
284
-
285
-
286
-
287
-
288
-
289
-
290
-
291
-
292
-
293
-
294
-
295
-
296
-
297
-
298
-
299
-
300
-
301
-
302
-
303
 |
 |

Business review: BP in more depth
Business review: BP in more depth
BP Annual Report and Form 20-F 2012
85
t Internal audit, whose role is to consider whether the group’s system of
internal control is adequately designed and operating effectively to
respond appropriately to the risks that are significant to BP.
t Approval hierarchy, whereby proved reserves changes above certain
threshold volumes require central authorization and periodic reviews.
The frequency of review is determined according to field size and
ensures that more than 80% of the BP proved reserves base
undergoes central review every two years, and more than 90% is
reviewed centrally every four years. In addition, BP commenced a
review of certain of its assets and estimation processes. This review
process will continue through 2013.
BP’s vice president of segment reserves is the petroleum engineer
primarily responsible for overseeing the preparation of the reserves
estimate. He has nearly 30 years of diversified industry experience with
the past eight spent managing the governance and compliance of BP’s
reserves estimation. He is a past member of the Society of Petroleum
Engineers Oil and Gas Reserves Committee, a sitting member of the
American Association of Petroleum Geologists Committee on Resource
Evaluation and chair of the bureau of the United Nations Economic
Commission for Europe Expert Group on Resource Classification.
For the executive directors and senior management, no specific portion
of compensation bonuses is directly related to proved reserves targets.
Additions to proved reserves is one of several indicators by which the
performance of the Upstream segment is assessed by the remuneration
committee for the purposes of determining compensation bonuses for
the executive directors. Other indicators include a number of financial and
operational measures.
BP’s variable pay programme for the other senior managers in the
Upstream segment is based on individual performance contracts.
Individual performance contracts are based on agreed items from the
business performance plan, one of which, if chosen, could relate to
proved reserves.
Compliance
International Financial Reporting Standards (IFRS) do not provide specific
guidance on reserves disclosures. BP estimates proved reserves in
accordance with SEC Rule 4-10 (a) of Regulation S-X and relevant
Compliance and Disclosure Interpretations (C&DI) and Staff Accounting
Bulletins as issued by the SEC staff.
By their nature, there is always some risk involved in the ultimate
development and production of proved reserves including, but not limited
to: final regulatory approval; the installation of new or additional
infrastructure, as well as changes in oil and gas prices; changes in
operating and development costs; and the continued availability of
additional development capital. All the group’s proved reserves held in
subsidiaries and equity-accounted entities are estimated by the group’s
petroleum engineers.
Our proved reserves are associated with both concessions (tax and
royalty arrangements) and agreements where the group is exposed to the
upstream risks and rewards of ownership, but where our entitlement to
the hydrocarbons is calculated using a more complex formula, such as
with PSAs. In a concession, the consortium of which we are a part is
entitled to the proved reserves that can be produced over the licence
period, which may be the life of the field. In a PSA, we are entitled to
recover volumes that equate to costs incurred to develop and produce the
proved reserves and an agreed share of the remaining volumes or the
economic equivalent. As part of our entitlement is driven by the monetary
amount of costs to be recovered, price fluctuations will have an impact on
both production volumes and reserves.
We disclose our share of proved reserves held in equity-accounted
entities (jointly controlled entities and associates), although we do not
control these entities or the assets held by such entities.
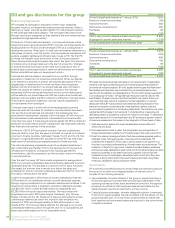
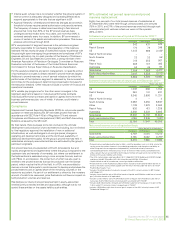
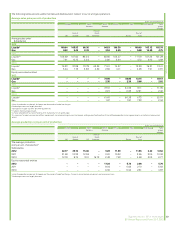
BP’s estimated net proved reserves and proved
reserves replacement
Eighty-two per cent of our total proved reserves of subsidiaries at
31 December 2012 were held through unincorporated joint ventures
(75% in 2011), and 31% of the proved reserves were held through such
unincorporated joint ventures where we were not the operator
(33% in 2011).
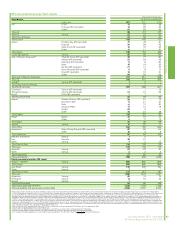
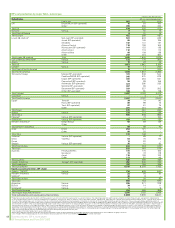
Estimated net proved reserves of liquids at 31 December 2012 a b c
million barrels
Developed Undeveloped Total
UK 242 431 673
Rest of Europe 170 79 249
US 1,443 989 2,432d
Rest of North America ––
–
South America 22 32 54e
Africa 312 255 567
Rest of Asia 268 137 405
Australasia 52 45 97
Subsidiaries 2,509 1,968 4,477f
Equity-accounted entities 3,041 2,532 5,573g h
Total 5,550 4,500 10,050
Estimated net proved reserves of natural gas at 31 December 2012a b
billion cubic feet
Developed Undeveloped Total
UK 1,038 666 1,704
Rest of Europe 340 141 481
US 8,245 2,986 11,231
Rest of North America 4–
4
South America 3,588 6,250 9,838i
Africa 1,139 1,923 3,062
Rest of Asia 926 413 1,339
Australasia 3,282 2,323 5,605
Subsidiaries 18,562 14,702 33,264f
Equity-accounted entities 4,196 2,845 7,041g h
Total 22,758 17,547 40,305
Net proved reserves on an oil equivalent basis
million barrels of oil equivalent
Developed Undeveloped Total
Subsidiaries 5,709 4,504 10,213f
Equity-accounted entities 3,765 3,022 6,787g
Total 9,474 7,526 17,000
a Proved reserves exclude royalties due to others, whether payable in cash or in kind, where the
royalty owner has a direct interest in the underlying production and the option and ability to
make lifting and sales arrangements independently, and include minority interests in
consolidated operations. We disclose our share of reserves held in jointly controlled entities
and associates that are accounted for by the equity method although we do not control these
entities or the assets held by such entities.
b The 2012 marker prices used were Brent $111.13/bbl (2011 $110.96/bbl and 2010 $79.02/bbl)
and Henry Hub $2.75/mmBtu (2011 $4.12/mmBtu and 2010 $4.37/mmBtu).
c Liquids include crude oil, condensate, natural gas liquids and bitumen.
d Proved reserves in the Prudhoe Bay field in Alaska include an estimated 76 million barrels on
which a net profits royalty will be payable over the life of the field under the terms of the BP
Prudhoe Bay Royalty Trust.
e Includes 14 million barrels of crude oil in respect of the 30% minority interest in BP Trinidad
and Tobago LLC.
f Includes assets held for sale of 39 million barrels of liquids and 590 billion cubic feet of natural
gas (140 million barrels of oil equivalent).
g Includes assets held for sale of 4,540 million barrels of liquids and 4,492 billion cubic feet of
natural gas (5,315 million barrels of oil equivalent) associated with TNK-BP.
h Includes 328 million barrels of liquids and 270 billion cubic feet of natural gas in respect of the
7.35% and 6.17% minority interests respectively in TNK-BP.
i Includes 2,890 billion cubic feet of natural gas in respect of the 30% minority interest in BP
Trinidad and Tobago LLC.