BP 2012 Annual Report Download - page 221
Download and view the complete annual report
Please find page 221 of the 2012 BP annual report below. You can navigate through the pages in the report by either clicking on the pages listed below, or by using the keyword search tool below to find specific information within the annual report.-
 1
1 -
2
-
3
-
4
-
5
-
6
-
7
-
8
-
9
-
10
-
11
-
12
-
13
-
14
-
15
-
16
-
17
-
18
-
19
-
20
-
21
-
22
-
23
-
24
-
25
-
26
-
27
-
28
-
29
-
30
-
31
-
32
-
33
-
34
-
35
-
36
-
37
-
38
-
39
-
40
-
41
-
42
-
43
-
44
-
45
-
46
-
47
-
48
-
49
-
50
-
51
-
52
-
53
-
54
-
55
-
56
-
57
-
58
-
59
-
60
-
61
-
62
-
63
-
64
-
65
-
66
-
67
-
68
-
69
-
70
-
71
-
72
-
73
-
74
-
75
-
76
-
77
-
78
-
79
-
80
-
81
-
82
-
83
-
84
-
85
-
86
-
87
-
88
-
89
-
90
-
91
-
92
-
93
-
94
-
95
-
96
-
97
-
98
-
99
-
100
-
101
-
102
-
103
-
104
-
105
-
106
-
107
-
108
-
109
-
110
-
111
-
112
-
113
-
114
-
115
-
116
-
117
-
118
-
119
-
120
-
121
-
122
-
123
-
124
-
125
-
126
-
127
-
128
-
129
-
130
-
131
-
132
-
133
-
134
-
135
-
136
-
137
-
138
-
139
-
140
-
141
-
142
-
143
-
144
-
145
-
146
-
147
-
148
-
149
-
150
-
151
-
152
-
153
-
154
-
155
-
156
-
157
-
158
-
159
-
160
-
161
-
162
-
163
-
164
-
165
-
166
-
167
-
168
-
169
-
170
-
171
-
172
-
173
-
174
-
175
-
176
-
177
-
178
-
179
-
180
-
181
-
182
-
183
-
184
-
185
-
186
-
187
-
188
-
189
-
190
-
191
-
192
-
193
-
194
-
195
-
196
-
197
-
198
-
199
-
200
-
201
-
202
-
203
-
204
-
205
-
206
-
207
-
208
-
209
-
210
-
 211
211 -
 212
212 -
 213
213 -
 214
214 -
 215
215 -
 216
216 -
 217
217 -
 218
218 -
 219
219 -
 220
220 -
 221
221 -
 222
222 -
 223
223 -
 224
224 -
 225
225 -
 226
226 -
 227
227 -
 228
228 -
 229
229 -
 230
230 -
 231
231 -
232
-
233
-
234
-
235
-
236
-
237
-
238
-
239
-
240
-
241
-
242
-
243
-
244
-
245
-
246
-
247
-
248
-
249
-
250
-
251
-
252
-
253
-
254
-
255
-
256
-
257
-
258
-
259
-
260
-
261
-
262
-
263
-
264
-
265
-
266
-
267
-
268
-
269
-
270
-
271
-
272
-
273
-
274
-
275
-
276
-
277
-
278
-
279
-
280
-
281
-
282
-
283
-
284
-
285
-
286
-
287
-
288
-
289
-
290
-
291
-
292
-
293
-
294
-
295
-
296
-
297
-
298
-
299
-
300
-
301
-
302
-
303
 |
 |

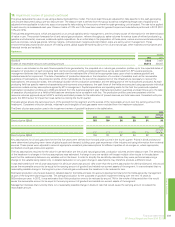
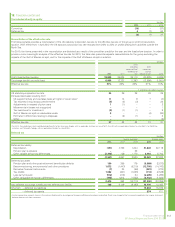
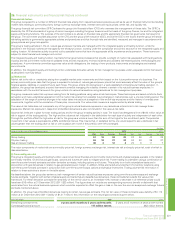
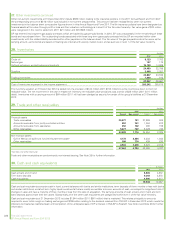
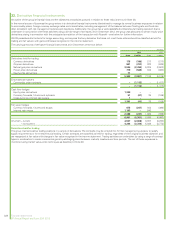
25. Investments in associates
The significant associates of the BP group at 31 December 2012 are shown in Note 45. Summarized financial information for the group’s share of
associates is set out below. Balance sheet information shown below excludes data relating to associates reclassified as assets held for sale as at the
end of the period. Income statement information shown below includes data relating to associates reclassified as assets held for sale for the period up
until their date of reclassification as held for sale.
$ million
2012 2011 2010
TNK-BP Other Total TNK-BP Other Total TNK-BP Other Total
Sales and other operating revenues 24,675 11,965 36,640 30,100 12,145 42,245 22,323 10,031 32,354
Profit before interest and taxation 4,405 906 5,311 5,992 958 6,950 3,866 1,215 5,081
Finance costs 84 16 100 132 13 145 128 22 150
Profit before taxation 4,321 890 5,211 5,860 945 6,805 3,738 1,193 4,931
Taxation 979 201 1,180 1,333 214 1,547 913 228 1,141
Minority interest 356 – 356 342 – 342 208 – 208
Profit for the year 2,986 689 3,675 4,185 731 4,916 2,617 965 3,582
Non-current assets 3,270 16,172 3,865 20,037
Current assets 2,399 4,210 2,273 6,483
Total assets 5,669 20,382 6,138 26,520
Current liabilities 2,126 3,086 2,149 5,235
Non-current liabilities 1,290 6,416 1,744 8,160
Total liabilities 3,416 9,502 3,893 13,395
Minority interest –867 – 867
2,253 10,013 2,245 12,258
Group investment in associates
Group share of net assets (as above) 2,253 10,013 2,245 12,258
Loans made by group companies to
associates 745 – 1,033 1,033
2,998 10,013 3,278 13,291
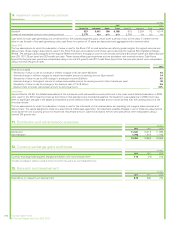
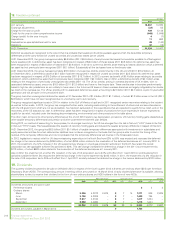
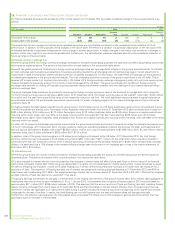
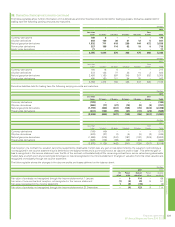
Transactions between the group and its associates are summarized below.
$ million
Sales to associates 2012 2011 2010
Product Sales
Amount
receivable at
31 December Sales
Amount
receivable at
31 December Sales
Amount
receivable at
31 December
LNG, crude oil and oil products, natural gas, employee services 3,771 401 3,855 393 3,561 330
$ million
Purchases from associates 2012 2011 2010
Product Purchases
Amount
payable at
31 December Purchases
Amount
payable at
31 December Purchases
Amount
payable at
31 December
Crude oil and oil products, natural gas, transportation tariff 9,135 915 8,159 815 4,889 633
The terms of the outstanding balances receivable from associates are typically 30 to 45 days. The balances are unsecured and will be settled in cash.
There are no significant provisions for doubtful debts relating to these balances and no significant expense recognized in the income statement in
respect of bad or doubtful debts.
The amounts receivable and payable at 31 December 2012, as shown in the table above, exclude $159 million (2011 $220 million) due from and due
to an intermediate associate which provides funding for our associate The Baku-Tbilisi-Ceyhan Pipeline Company. These balances are expected to be
settled in cash throughout the period to 2015.
Dividends receivable at 31 December 2012 of $34 million (2011 $38 million) are also excluded from the table above.
BP has commitments amounting to $595 million (2011 $1,477 million) in relation to contracts with its associates for the purchase of crude oil and oil
products, transportation and storage. See Note 44 for further information on capital commitments relating to BP’s investments in associates.
On 18 October 2010, BP announced that it had reached agreement to sell assets in Vietnam, together with its upstream businesses and associated
interests in Venezuela, to TNK-BP. As at 31 December 2010, a deposit of $1 billion had been received from TNK-BP in advance of completion of this
transaction and was reported within finance debt on the group balance sheet. This deposit was not reflected in the amount payable in the table above.
These sales completed during 2011.
Financial statements 219
BP Annual Report and Form 20-F 2012
Financial statements