BP 2012 Annual Report Download - page 298
Download and view the complete annual report
Please find page 298 of the 2012 BP annual report below. You can navigate through the pages in the report by either clicking on the pages listed below, or by using the keyword search tool below to find specific information within the annual report.-
 1
1 -
2
-
3
-
4
-
5
-
6
-
7
-
8
-
9
-
10
-
11
-
12
-
13
-
14
-
15
-
16
-
17
-
18
-
19
-
20
-
21
-
22
-
23
-
24
-
25
-
26
-
27
-
28
-
29
-
30
-
31
-
32
-
33
-
34
-
35
-
36
-
37
-
38
-
39
-
40
-
41
-
42
-
43
-
44
-
45
-
46
-
47
-
48
-
49
-
50
-
51
-
52
-
53
-
54
-
55
-
56
-
57
-
58
-
59
-
60
-
61
-
62
-
63
-
64
-
65
-
66
-
67
-
68
-
69
-
70
-
71
-
72
-
73
-
74
-
75
-
76
-
77
-
78
-
79
-
80
-
81
-
82
-
83
-
84
-
85
-
86
-
87
-
88
-
89
-
90
-
91
-
92
-
93
-
94
-
95
-
96
-
97
-
98
-
99
-
100
-
101
-
102
-
103
-
104
-
105
-
106
-
107
-
108
-
109
-
110
-
111
-
112
-
113
-
114
-
115
-
116
-
117
-
118
-
119
-
120
-
121
-
122
-
123
-
124
-
125
-
126
-
127
-
128
-
129
-
130
-
131
-
132
-
133
-
134
-
135
-
136
-
137
-
138
-
139
-
140
-
141
-
142
-
143
-
144
-
145
-
146
-
147
-
148
-
149
-
150
-
151
-
152
-
153
-
154
-
155
-
156
-
157
-
158
-
159
-
160
-
161
-
162
-
163
-
164
-
165
-
166
-
167
-
168
-
169
-
170
-
171
-
172
-
173
-
174
-
175
-
176
-
177
-
178
-
179
-
180
-
181
-
182
-
183
-
184
-
185
-
186
-
187
-
188
-
189
-
190
-
191
-
192
-
193
-
194
-
195
-
196
-
197
-
198
-
199
-
200
-
201
-
202
-
203
-
204
-
205
-
206
-
207
-
208
-
209
-
210
-
211
-
212
-
213
-
214
-
215
-
216
-
217
-
218
-
219
-
220
-
221
-
222
-
223
-
224
-
225
-
226
-
227
-
228
-
229
-
230
-
231
-
232
-
233
-
234
-
235
-
236
-
237
-
238
-
239
-
240
-
241
-
242
-
243
-
244
-
245
-
246
-
247
-
248
-
249
-
250
-
251
-
252
-
253
-
254
-
255
-
256
-
257
-
258
-
259
-
260
-
261
-
262
-
263
-
264
-
265
-
266
-
267
-
268
-
269
-
270
-
271
-
272
-
273
-
274
-
275
-
276
-
277
-
278
-
279
-
280
-
281
-
282
-
283
-
284
-
285
-
286
-
287
-
 288
288 -
 289
289 -
 290
290 -
 291
291 -
 292
292 -
 293
293 -
 294
294 -
 295
295 -
 296
296 -
 297
297 -
 298
298 -
 299
299 -
 300
300 -
 301
301 -
 302
302 -
 303
303
 |
 |

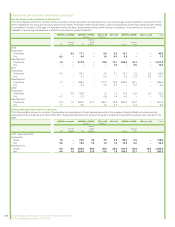
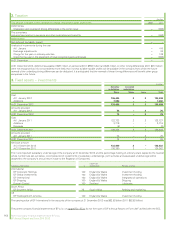
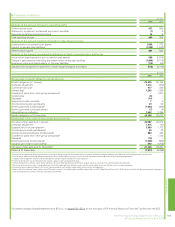
6. Pensions continued
$ million
2012 2011
Reconciliation of plan deficit to balance sheet
Deficit at 31 December (1,913) (2,088)
Deferred tax ––
(1,913) (2,088)
Represented by
Liability recognized on balance sheet (1,913) (2,088)
(1,913) (2,088)
The aggregate level of employer contributions into the BP Pension Fund in 2013 is expected to be $496 million.
$ million
2012 2011 2010 2009 2008
History of (deficit) surplus and of experience gains and losses
Benefit obligation at 31 December 29,259 25,675 20,742 19,882 15,414
Fair value of plan assets at 31 December 27,346 23,587 22,612 20,953 16,930
(Deficit) surplus (1,913) (2,088) 1,870 1,071 1,516
Experience gains and losses on plan liabilities
Amount ($ million) (116) (84) 12 (146) (65)
Percentage of benefit obligation 0% 0% 0% (1%) 0%
Actual return less expected return on pension plan assets
Amount ($ million) 989 (1,976) 1,479 1,634 (6,533)
Percentage of plan assets 4% (8%) 7% 8% (39%)
Actuarial (loss) gain recognized in statement of total recognized gains and losses
Amount ($ million) (573) (4,770) 457 (585) (5,122)
Percentage of benefit obligation (2%) (19%) 2% (3%) (33%)
Cumulative amount recognized in statement of total recognized gains and losses (6,578) (6,005) (1,235) (1,692) (1,107)
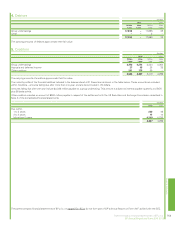
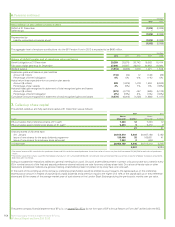
7. Called-up share capital
The allotted, called-up and fully paid share capital at 31 December was as follows:
2012 2011
Issued
Shares
(thousand) $ million
Shares
(thousand) $ million
8% cumulative first preference shares of £1 eacha7,233 12 7,233 12
9% cumulative second preference shares of £1 eacha5,473 9 5,473 9
21 21
Ordinary shares of 25 cents each
At 1 January 20,813,410 5,203 20,647,160 5,162
Issue of new shares for the scrip dividend programme 138,406 35 165,601 41
Issue of new shares for employee share schemesb7,343 2 649 –
31 December 20,959,159 5,240 20,813,410 5,203
5,261 5,224
aThe nominal amount of 8% cumulative first preference shares and 9% cumulative second preference shares that can be in issue at any time shall not exceed £10,000,000 for each class of preference
shares.
bThe nominal value of new shares issued for the employee share plans in 2011 amounted to $162,000. Consideration received relating to the issue of new shares for employee share plans amounted to
$46 million (2011 $4 million).
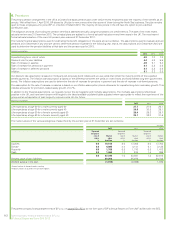
Voting on substantive resolutions tabled at a general meeting is on a poll. On a poll, shareholders present in person or by proxy have two votes for every
£5 in nominal amount of the first and second preference shares held and one vote for every ordinary share held. On a show-of-hands vote on other
resolutions (procedural matters) at a general meeting, shareholders present in person or by proxy have one vote each.
In the event of the winding up of the company, preference shareholders would be entitled to a sum equal to the capital paid up on the preference
shares plus an amount in respect of accrued and unpaid dividends and a premium equal to the higher of (i) 10% of the capital paid up on the preference
shares and (ii) the excess of the average market price of such shares on the London Stock Exchange during the previous six months over par value.
PC9 Parent company financial statements of BP p.l.c.
BP Annual Report and Form 20-F 2012
The parent company financial statements of BP p.l.c. on pages PC1–PC11 do not form part of BP’s Annual Report on Form 20-F as filed with the SEC.