BP 2012 Annual Report Download - page 6
Download and view the complete annual report
Please find page 6 of the 2012 BP annual report below. You can navigate through the pages in the report by either clicking on the pages listed below, or by using the keyword search tool below to find specific information within the annual report.-
 1
1 -
 2
2 -
 3
3 -
 4
4 -
 5
5 -
 6
6 -
 7
7 -
 8
8 -
 9
9 -
 10
10 -
 11
11 -
 12
12 -
 13
13 -
 14
14 -
 15
15 -
 16
16 -
 17
17 -
18
-
19
-
20
-
21
-
22
-
23
-
24
-
25
-
26
-
27
-
28
-
29
-
30
-
31
-
32
-
33
-
34
-
35
-
36
-
37
-
38
-
39
-
40
-
41
-
42
-
43
-
44
-
45
-
46
-
47
-
48
-
49
-
50
-
51
-
52
-
53
-
54
-
55
-
56
-
57
-
58
-
59
-
60
-
61
-
62
-
63
-
64
-
65
-
66
-
67
-
68
-
69
-
70
-
71
-
72
-
73
-
74
-
75
-
76
-
77
-
78
-
79
-
80
-
81
-
82
-
83
-
84
-
85
-
86
-
87
-
88
-
89
-
90
-
91
-
92
-
93
-
94
-
95
-
96
-
97
-
98
-
99
-
100
-
101
-
102
-
103
-
104
-
105
-
106
-
107
-
108
-
109
-
110
-
111
-
112
-
113
-
114
-
115
-
116
-
117
-
118
-
119
-
120
-
121
-
122
-
123
-
124
-
125
-
126
-
127
-
128
-
129
-
130
-
131
-
132
-
133
-
134
-
135
-
136
-
137
-
138
-
139
-
140
-
141
-
142
-
143
-
144
-
145
-
146
-
147
-
148
-
149
-
150
-
151
-
152
-
153
-
154
-
155
-
156
-
157
-
158
-
159
-
160
-
161
-
162
-
163
-
164
-
165
-
166
-
167
-
168
-
169
-
170
-
171
-
172
-
173
-
174
-
175
-
176
-
177
-
178
-
179
-
180
-
181
-
182
-
183
-
184
-
185
-
186
-
187
-
188
-
189
-
190
-
191
-
192
-
193
-
194
-
195
-
196
-
197
-
198
-
199
-
200
-
201
-
202
-
203
-
204
-
205
-
206
-
207
-
208
-
209
-
210
-
211
-
212
-
213
-
214
-
215
-
216
-
217
-
218
-
219
-
220
-
221
-
222
-
223
-
224
-
225
-
226
-
227
-
228
-
229
-
230
-
231
-
232
-
233
-
234
-
235
-
236
-
237
-
238
-
239
-
240
-
241
-
242
-
243
-
244
-
245
-
246
-
247
-
248
-
249
-
250
-
251
-
252
-
253
-
254
-
255
-
256
-
257
-
258
-
259
-
260
-
261
-
262
-
263
-
264
-
265
-
266
-
267
-
268
-
269
-
270
-
271
-
272
-
273
-
274
-
275
-
276
-
277
-
278
-
279
-
280
-
281
-
282
-
283
-
284
-
285
-
286
-
287
-
288
-
289
-
290
-
291
-
292
-
293
-
294
-
295
-
296
-
297
-
298
-
299
-
300
-
301
-
302
-
303
 |
 |

BP at a glance
BP Annual Report and Form 20-F 2012
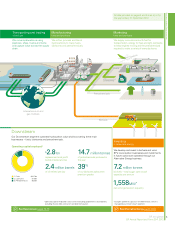
Our business modelWho we are
We aim to create value for
shareholders by helping to
meet growing demand for
energy in a responsible way.
Our activities also generate jobs, investment,
infrastructure and revenues for governments
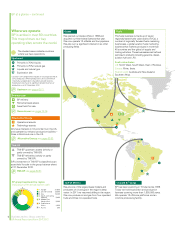
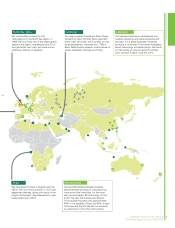
and local communities. We operate in over
80 countries.
Our priorities are to enhance safety and
risk management, earn back trust and grow
value. We strive to be a safety leader in our
industry, a world-class operator, a responsible
corporate citizen and a good employer.
We are working to build a stronger, safer
BP that plays to its distinctive strengths and
capabilities: exploration, operations in deep
water, the managing of giant fields and gas
value chains, and our downstream business.
Innovative technology and strong relationships
with governments, partners and communities
around the world underpin our activities.
Finding
oil and gas
Developing and extracting
oil and gas
First, we acquire exploration rights,
then we search for hydrocarbons
beneath the earth’s surface.
Once we have found hydrocarbons,
we work to bring them to the surface.
Upstream
Our Upstream segment manages its exploration, development and production activities
through global functions with specialist areas of expertise.
BP at a glance
See Upstream pages 63-71.
1. Subsidiaries 4,477
2. Equity-accounted entities 1,033
Total 5,510
Total 6,175
3.
Subsidiaries 5,736
4. Equity-accounted entities 439
Liquidsc
Natural gas
1
4
2
3
Proved reservesb
$22.5 bn
replacement cost profit
before interest and tax
67,900km2
new exploration access
5
major project start-ups
28
countries of operation
b Million barrels of oil equivalent. Natural gas is converted to oil equivalent at
5.8 billion cubic feet (bcf) = 1 million barrels.
c Liquids comprise crude oil, condensate, natural gas liquids and bitumen.
See KPIs pages 28-29.
1
2
32. Upstream 24,000
1. Downstream* 51,300
3. Other businesses 10,400
and corporate
and Gulf Coast
Restoration
Organization
Total 85,700
* Including service station
staff.
Employees by business segment
18.7%
gearing
(net debt ratio)a
$20.4 bn
operating cash flow
$11.6 bn
profit attributable to
BP shareholders
19%
reduction in loss of
primary containment
a Net debt is not a recognized GAAP measure,
see Financial statements Note 35.
Group
BP p.l.c. is the parent company of the
BP group of companies. Our worldwide
headquarters is in London.
Business model
For more information on our business
model see pages 15 -19.
The key performance indicators (KPIs) for
BP are shown on pages 28-29. Some of the
financial KPIs are not recognized GAAP
measures, but are provided for investors
because they are closely tracked by
management to evaluate BP’s operating
performance and to make financial, strategic
and operating decisions.
4