BP 2012 Annual Report Download - page 233
Download and view the complete annual report
Please find page 233 of the 2012 BP annual report below. You can navigate through the pages in the report by either clicking on the pages listed below, or by using the keyword search tool below to find specific information within the annual report.-
 1
1 -
2
-
3
-
4
-
5
-
6
-
7
-
8
-
9
-
10
-
11
-
12
-
13
-
14
-
15
-
16
-
17
-
18
-
19
-
20
-
21
-
22
-
23
-
24
-
25
-
26
-
27
-
28
-
29
-
30
-
31
-
32
-
33
-
34
-
35
-
36
-
37
-
38
-
39
-
40
-
41
-
42
-
43
-
44
-
45
-
46
-
47
-
48
-
49
-
50
-
51
-
52
-
53
-
54
-
55
-
56
-
57
-
58
-
59
-
60
-
61
-
62
-
63
-
64
-
65
-
66
-
67
-
68
-
69
-
70
-
71
-
72
-
73
-
74
-
75
-
76
-
77
-
78
-
79
-
80
-
81
-
82
-
83
-
84
-
85
-
86
-
87
-
88
-
89
-
90
-
91
-
92
-
93
-
94
-
95
-
96
-
97
-
98
-
99
-
100
-
101
-
102
-
103
-
104
-
105
-
106
-
107
-
108
-
109
-
110
-
111
-
112
-
113
-
114
-
115
-
116
-
117
-
118
-
119
-
120
-
121
-
122
-
123
-
124
-
125
-
126
-
127
-
128
-
129
-
130
-
131
-
132
-
133
-
134
-
135
-
136
-
137
-
138
-
139
-
140
-
141
-
142
-
143
-
144
-
145
-
146
-
147
-
148
-
149
-
150
-
151
-
152
-
153
-
154
-
155
-
156
-
157
-
158
-
159
-
160
-
161
-
162
-
163
-
164
-
165
-
166
-
167
-
168
-
169
-
170
-
171
-
172
-
173
-
174
-
175
-
176
-
177
-
178
-
179
-
180
-
181
-
182
-
183
-
184
-
185
-
186
-
187
-
188
-
189
-
190
-
191
-
192
-
193
-
194
-
195
-
196
-
197
-
198
-
199
-
200
-
201
-
202
-
203
-
204
-
205
-
206
-
207
-
208
-
209
-
210
-
211
-
212
-
213
-
214
-
215
-
216
-
217
-
218
-
219
-
220
-
221
-
222
-
 223
223 -
 224
224 -
 225
225 -
 226
226 -
 227
227 -
 228
228 -
 229
229 -
 230
230 -
 231
231 -
 232
232 -
 233
233 -
 234
234 -
 235
235 -
 236
236 -
 237
237 -
 238
238 -
 239
239 -
 240
240 -
 241
241 -
 242
242 -
 243
243 -
244
-
245
-
246
-
247
-
248
-
249
-
250
-
251
-
252
-
253
-
254
-
255
-
256
-
257
-
258
-
259
-
260
-
261
-
262
-
263
-
264
-
265
-
266
-
267
-
268
-
269
-
270
-
271
-
272
-
273
-
274
-
275
-
276
-
277
-
278
-
279
-
280
-
281
-
282
-
283
-
284
-
285
-
286
-
287
-
288
-
289
-
290
-
291
-
292
-
293
-
294
-
295
-
296
-
297
-
298
-
299
-
300
-
301
-
302
-
303
 |
 |

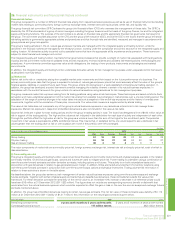
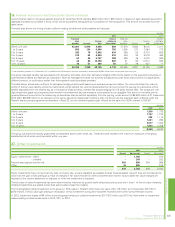
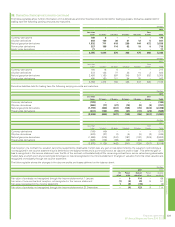
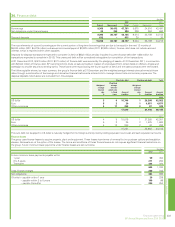
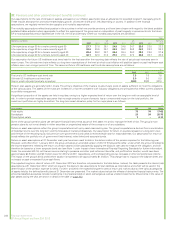
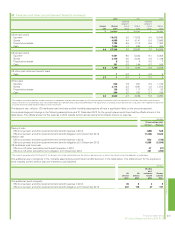
The following table shows the changes during the year in the net fair value of derivatives held for trading purposes within level 3 of the fair value
hierarchy.
$ million
Oil
price
Natural gas
price
Power
price
Equity
price Total
Net fair value of contracts at 1 January 2012 162 408 13 – 583
Gains (losses) recognized in the income statement 30 4 (4) – 30
New contracts –––7171
Settlements (87) (56) – – (143)
Transfers into level 3 – (19) – – (19)
Transfers out of level 3 – (33) (51) – (84)
Exchange adjustments – – (1) – (1)
Net fair value of contracts at 31 December 2012 105 304 (43) 71 437
$ million
Oil
price
Natural gas
price
Power
price Total
Net fair value of contracts at 1 January 2011 164 667 (1) 830
Gains (losses) recognized in the income statement 69 129 11 209
Settlements (71) (110) 3 (178)
Transfers out of level 3 – (278) – (278)
Net fair value of contracts at 31 December 2011 162 408 13 583
Transfers out of level 3 of the fair value hierarchy in 2012 relate primarily to the delivery dates for a number of natural gas and power forward contracts
moving into a time period where market observable prices are available, and therefore being reclassified to level 2 of the fair value hierarchy.
The amount recognized in the income statement for the year relating to level 3 held for trading derivatives still held at 31 December 2012 was a
$10 million gain (2011 $204 million gain relating to derivatives still held at 31 December 2011).
Gains and losses relating to derivative contracts are included either within sales and other operating revenues or within purchases in the income
statement depending upon the nature of the activity and type of contract involved. The contract types treated in this way include futures, options, swaps
and certain forward sales and forward purchases contracts, and relate to both currency and commodity trading activities. Gains or losses arise on
contracts entered into for risk management purposes, optimization activity and entrepreneurial trading. They also arise on certain contracts that are for
normal procurement or sales activity for the group but that are required to be fair valued under accounting standards. Also included within sales and
other operating revenues are gains and losses on inventory held for trading purposes. The total amount relating to all these items was a net loss of
$726 million (2011 $934 million net loss and 2010 $1,738 million net gain).
Embedded derivatives
The group has embedded derivatives, the majority of which relate to certain natural gas contracts. Prior to the development of an active gas trading
market, UK gas contracts were priced using a basket of available price indices, primarily relating to oil products, power and inflation. After the
development of an active UK gas market, certain contracts were entered into or renegotiated using pricing formulae not directly related to gas prices,for
example, oil product and power prices. In these circumstances, pricing formulae have been determined to be derivatives, embedded within the overall
contractual arrangements that are not clearly and closely related to the underlying commodity. The resulting fair value relating to these contracts is
recognized on the balance sheet with gains or losses recognized in the income statement.
All the commodity price embedded derivatives relate to natural gas contracts, are categorized in level 3 of the fair value hierarchy and are valued using
inputs that include price curves for each of the different products that are built up from active market pricing data. Where necessary, these are
extrapolated to the expiry of the contracts (the last of which is in 2018) using all available external pricing information. Additionally, where limited data
exists for certain products, prices are interpolated using historic and long-term pricing relationships.
Financial statements 231
BP Annual Report and Form 20-F 2012
Financial statements
33. Derivative financial instruments continued