BP 2012 Annual Report Download - page 229
Download and view the complete annual report
Please find page 229 of the 2012 BP annual report below. You can navigate through the pages in the report by either clicking on the pages listed below, or by using the keyword search tool below to find specific information within the annual report.-
 1
1 -
2
-
3
-
4
-
5
-
6
-
7
-
8
-
9
-
10
-
11
-
12
-
13
-
14
-
15
-
16
-
17
-
18
-
19
-
20
-
21
-
22
-
23
-
24
-
25
-
26
-
27
-
28
-
29
-
30
-
31
-
32
-
33
-
34
-
35
-
36
-
37
-
38
-
39
-
40
-
41
-
42
-
43
-
44
-
45
-
46
-
47
-
48
-
49
-
50
-
51
-
52
-
53
-
54
-
55
-
56
-
57
-
58
-
59
-
60
-
61
-
62
-
63
-
64
-
65
-
66
-
67
-
68
-
69
-
70
-
71
-
72
-
73
-
74
-
75
-
76
-
77
-
78
-
79
-
80
-
81
-
82
-
83
-
84
-
85
-
86
-
87
-
88
-
89
-
90
-
91
-
92
-
93
-
94
-
95
-
96
-
97
-
98
-
99
-
100
-
101
-
102
-
103
-
104
-
105
-
106
-
107
-
108
-
109
-
110
-
111
-
112
-
113
-
114
-
115
-
116
-
117
-
118
-
119
-
120
-
121
-
122
-
123
-
124
-
125
-
126
-
127
-
128
-
129
-
130
-
131
-
132
-
133
-
134
-
135
-
136
-
137
-
138
-
139
-
140
-
141
-
142
-
143
-
144
-
145
-
146
-
147
-
148
-
149
-
150
-
151
-
152
-
153
-
154
-
155
-
156
-
157
-
158
-
159
-
160
-
161
-
162
-
163
-
164
-
165
-
166
-
167
-
168
-
169
-
170
-
171
-
172
-
173
-
174
-
175
-
176
-
177
-
178
-
179
-
180
-
181
-
182
-
183
-
184
-
185
-
186
-
187
-
188
-
189
-
190
-
191
-
192
-
193
-
194
-
195
-
196
-
197
-
198
-
199
-
200
-
201
-
202
-
203
-
204
-
205
-
206
-
207
-
208
-
209
-
210
-
211
-
212
-
213
-
214
-
215
-
216
-
217
-
218
-
 219
219 -
 220
220 -
 221
221 -
 222
222 -
 223
223 -
 224
224 -
 225
225 -
 226
226 -
 227
227 -
 228
228 -
 229
229 -
 230
230 -
 231
231 -
 232
232 -
 233
233 -
 234
234 -
 235
235 -
 236
236 -
 237
237 -
 238
238 -
 239
239 -
240
-
241
-
242
-
243
-
244
-
245
-
246
-
247
-
248
-
249
-
250
-
251
-
252
-
253
-
254
-
255
-
256
-
257
-
258
-
259
-
260
-
261
-
262
-
263
-
264
-
265
-
266
-
267
-
268
-
269
-
270
-
271
-
272
-
273
-
274
-
275
-
276
-
277
-
278
-
279
-
280
-
281
-
282
-
283
-
284
-
285
-
286
-
287
-
288
-
289
-
290
-
291
-
292
-
293
-
294
-
295
-
296
-
297
-
298
-
299
-
300
-
301
-
302
-
303
 |
 |

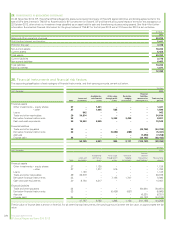
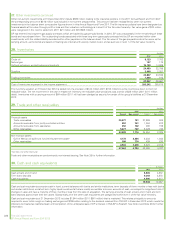
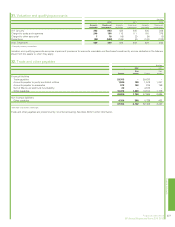
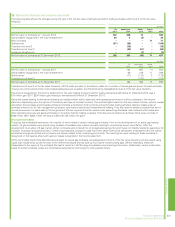
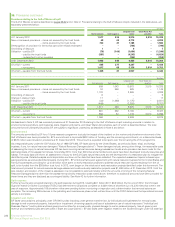
31. Valuation and qualifying accounts
$ million
2012 2011 2010
Accounts
receivable
Fixed asset
investments
Accounts
receivable
Fixed asset
investments
Accounts
receivable
Fixed asset
investments
At 1 January 332 643 428 540 430 349
Charged to costs and expenses 240 196 115 111 150 376
Charged to other accountsa718(16) (3) (9) (3)
Deductions (90) (508) (195) (5) (143) (182)
At 31 December 489 349 332 643 428 540
aPrincipally currency transactions.
Valuation and qualifying accounts comprise impairment provisions for accounts receivable and fixed asset investments, and are deducted in the balance
sheet from the assets to which they apply.
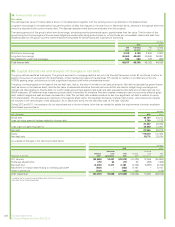
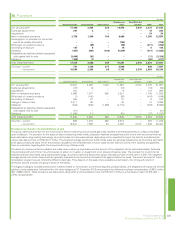
32. Trade and other payables
$ million
2012 2011
Current
Non-
current Current
Non-
current
Financial liabilities
Trade payables 29,703 – 29,830 –
Amounts payable to jointly controlled entities 1,580 158 1,578 1,047
Amounts payable to associates 972 102 876 159
Gulf of Mexico oil spill trust fund liabilitya22 – 4,872 –
Other payables 10,723 1,446 10,510 1,779
43,000 1,706 47,666 2,985
Non-financial liabilities
Other payables 4,154 396 4,739 452
47,154 2,102 52,405 3,437
aSee Note 2 for further information.
Trade and other payables are predominantly non-interest bearing. See Note 26 for further information.
Financial statements 227
BP Annual Report and Form 20-F 2012
Financial statements