BP 2012 Annual Report Download - page 38
Download and view the complete annual report
Please find page 38 of the 2012 BP annual report below. You can navigate through the pages in the report by either clicking on the pages listed below, or by using the keyword search tool below to find specific information within the annual report.-
 1
1 -
2
-
3
-
4
-
5
-
6
-
7
-
8
-
9
-
10
-
11
-
12
-
13
-
14
-
15
-
16
-
17
-
18
-
19
-
20
-
21
-
22
-
23
-
24
-
25
-
26
-
27
-
 28
28 -
 29
29 -
 30
30 -
 31
31 -
 32
32 -
 33
33 -
 34
34 -
 35
35 -
 36
36 -
 37
37 -
 38
38 -
 39
39 -
 40
40 -
 41
41 -
 42
42 -
 43
43 -
 44
44 -
 45
45 -
 46
46 -
 47
47 -
 48
48 -
49
-
50
-
51
-
52
-
53
-
54
-
55
-
56
-
57
-
58
-
59
-
60
-
61
-
62
-
63
-
64
-
65
-
66
-
67
-
68
-
69
-
70
-
71
-
72
-
73
-
74
-
75
-
76
-
77
-
78
-
79
-
80
-
81
-
82
-
83
-
84
-
85
-
86
-
87
-
88
-
89
-
90
-
91
-
92
-
93
-
94
-
95
-
96
-
97
-
98
-
99
-
100
-
101
-
102
-
103
-
104
-
105
-
106
-
107
-
108
-
109
-
110
-
111
-
112
-
113
-
114
-
115
-
116
-
117
-
118
-
119
-
120
-
121
-
122
-
123
-
124
-
125
-
126
-
127
-
128
-
129
-
130
-
131
-
132
-
133
-
134
-
135
-
136
-
137
-
138
-
139
-
140
-
141
-
142
-
143
-
144
-
145
-
146
-
147
-
148
-
149
-
150
-
151
-
152
-
153
-
154
-
155
-
156
-
157
-
158
-
159
-
160
-
161
-
162
-
163
-
164
-
165
-
166
-
167
-
168
-
169
-
170
-
171
-
172
-
173
-
174
-
175
-
176
-
177
-
178
-
179
-
180
-
181
-
182
-
183
-
184
-
185
-
186
-
187
-
188
-
189
-
190
-
191
-
192
-
193
-
194
-
195
-
196
-
197
-
198
-
199
-
200
-
201
-
202
-
203
-
204
-
205
-
206
-
207
-
208
-
209
-
210
-
211
-
212
-
213
-
214
-
215
-
216
-
217
-
218
-
219
-
220
-
221
-
222
-
223
-
224
-
225
-
226
-
227
-
228
-
229
-
230
-
231
-
232
-
233
-
234
-
235
-
236
-
237
-
238
-
239
-
240
-
241
-
242
-
243
-
244
-
245
-
246
-
247
-
248
-
249
-
250
-
251
-
252
-
253
-
254
-
255
-
256
-
257
-
258
-
259
-
260
-
261
-
262
-
263
-
264
-
265
-
266
-
267
-
268
-
269
-
270
-
271
-
272
-
273
-
274
-
275
-
276
-
277
-
278
-
279
-
280
-
281
-
282
-
283
-
284
-
285
-
286
-
287
-
288
-
289
-
290
-
291
-
292
-
293
-
294
-
295
-
296
-
297
-
298
-
299
-
300
-
301
-
302
-
303
 |
 |

Business review: BP in more depth
BP Annual Report and Form 20-F 2012
36
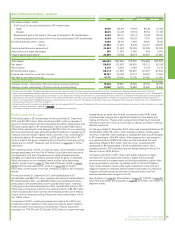
Finance costs and net finance expense relating to
pensions and other post-retirement benefits
Finance costs comprise interest payable less amounts capitalized, and
interest accretion on provisions and long-term other payables. Finance
costs in 2012 were $1,125 million compared with $1,246 million in 2011
and $1,170 million in 2010.
Net finance income relating to pensions and other post-retirement
benefits in 2012 was $201 million compared with $263 million in 2011 and
$47 million in 2010. In 2012, compared with 2011, the reduced net income
largely reflected lower expected returns on pension assets following
reductions in the yield assumptions, mainly for bonds, being applied in
2012 compared to 2011.
In 2013, when we adopt the revised version of IAS 19 ‘Employee
Benefits’, we will be required to apply the same expected rate of return
on plan assets as we use to discount our pension liabilities. We expect
this accounting change to adversely impact our annual earnings by
approximately $1 billion on a pre-tax basis, with no impact on cash flow.
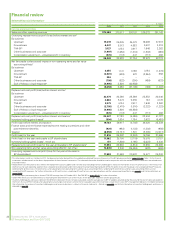
Taxation
The charge for corporate taxes in 2012 was $6,993 million, compared
with a charge of $12,737 million in 2011 and a credit of $1,501 million in
2010. The effective tax rate was 37% in 2012, 33% in 2011 and 31% in
2010. The group earns income in many countries and, on average, pays
taxes at rates higher than the UK statutory rate of 24%. The increase in
the effective tax rate in 2012 compared with 2011 primarily reflects the
impact of the provision for the settlement with the US government,
which is not tax deductible. The increase in the effective tax rate in 2011
compared with 2010 primarily reflected a higher level of income earned
in jurisdictions with a higher tax rate.
Acquisitions and disposals
In 2012 there were no significant acquisitions.
Total disposal proceeds received during 2012 were $11.4 billion.
In Upstream, total disposal proceeds of $10.7 billion included $5.55 billion
for the disposal of BP’s interests in the Marlin hub, Horn Mountain,
Holstein, Ram Powell and Diana Hoover fields in the Gulf of Mexico.
Proceeds of $1.5 billion were received for the sale of the Canadian natural
gas liquids (NGL) business to Plains Midstream Canada ULC, a wholly
owned subsidiary of Plains All American Pipeline, L.P. and
$1.2 billion for the Hugoton basin assets (including the Jayhawk NGL
processing plant and associated producing gas fields in Kansas) to an
affiliate of LINN Energy, LLC. The sale of BP’s interest in the Jonah and
Pinedale upstream operations in Wyoming, also to LINN Energy, LLC
generated disposal proceeds of $1.025 billion.
In Downstream, disposal proceeds totalled $0.5 billion, including the sale
of our interests in purified terephthalic acid production in Malaysia.
There were no significant disposals during 2012 in Other businesses and
corporate.
Prior years’ transactions
In 2011, BP acquired from Reliance Industries Limited (Reliance) a 30%
interest in each of 21 oil and gas production-sharing agreements operated
by Reliance in India for $7.0 billion. We completed the purchase, for
$3.6 billion, of 10 exploration and production blocks in Brazil, which was
the final part of a $7-billion transaction with Devon Energy that had been
announced in March 2010, and our Alternative Energy business acquired
the Brazilian sugar and ethanol producer Companhia Nacional de Açúcar e
Álcool (CNAA) for $0.7 billion. See Financial statements – Note 3 on
page 198 for further details of business combinations.
Total disposal proceeds received during 2011, after the repayment of the
disposal deposit relating to Pan American Energy LLC (PAE) (see below),
were $2.7 billion.
In Upstream, disposal proceeds included $0.6 billion from the sale of our
upstream assets in Pakistan to United Energy Pakistan Limited, a
subsidiary of United Energy Group (UEG); $0.5 billion from the sale of half
of the 3.29% interest in the Azeri-Chirag-Gunashli (ACG) development in
the Caspian Sea, which we had acquired from Devon Energy in 2010, to
Azerbaijan (ACG) Limited; and $0.5 billion from the sale of our interests in
the Wytch Farm, Wareham, Beacon and Kimmeridge fields to Perenco
UK Ltd. In addition, further payments of $1.1 billion were received on
completion of the sales of our upstream and certain midstream interests
in Venezuela and Vietnam and our oil and gas exploration, production and
transportation business in Colombia, for which we had received
$2.3 billion in 2010 as deposits. In November 2011, BP received from
Bridas Corporation (Bridas) a notice of termination of the agreement for
their purchase of BP’s 60% interest in PAE. As a result, the deposit of
$3.5 billion relating to the sale of PAE, which had been received by BP in
2010, was repaid to Bridas.
In Downstream we made disposals totalling $0.7 billion, which included
completion of the divestment of non-strategic pipelines and terminals in
the US, announced in 2009, for $0.3 billion and the disposal of our fuels
marketing businesses in several African countries for $0.2 billion.
Within Other businesses and corporate, we completed the sale of BP’s
wholly-owned subsidiary, ARCO Aluminum Inc., to a consortium of
Japanese companies for $0.7 billion.
In 2010, BP acquired a major portfolio of deepwater exploration acreage
and prospects in the US Gulf of Mexico and an additional interest in the
BP-operated ACG developments in the Caspian Sea, Azerbaijan, for
$2.9 billion, as part of a $7-billion transaction with Devon Energy. Total
disposal proceeds during 2010 were $17 billion, which included $7 billion
from the sale of US Permian Basin, Western Canadian gas assets, and
Western Desert exploration concessions in Egypt to Apache Corporation
(and an existing partner that exercised pre-emption rights), and $6.2 billion
of deposits received in advance of disposal transactions expected to
complete in 2011. Of these deposits received, $3.5 billion was for the sale
of our interest in PAE to Bridas; however, this was subsequently repaid to
Bridas at the end of 2011 following the termination of the sale agreement.
The deposits received also included $1 billion for the sale of our
upstream and midstream interests in Venezuela and Vietnam to TNK-BP,
and $1.3 billion for the sale of our oil and gas exploration, production and
transportation business in Colombia to a consortium of Ecopetrol and
Talisman.
In Downstream we made disposals totalling $1.8 billion in 2010, which
included our French retail fuels and convenience business to Delek
Europe; the fuels marketing business in Botswana to Puma Energy;
certain non-strategic pipelines and terminals in the US, our interests in
ethylene and polyethylene production in Malaysia to Petronas; and our
interest in a futures exchange.