BP 2012 Annual Report Download - page 244
Download and view the complete annual report
Please find page 244 of the 2012 BP annual report below. You can navigate through the pages in the report by either clicking on the pages listed below, or by using the keyword search tool below to find specific information within the annual report.-
 1
1 -
2
-
3
-
4
-
5
-
6
-
7
-
8
-
9
-
10
-
11
-
12
-
13
-
14
-
15
-
16
-
17
-
18
-
19
-
20
-
21
-
22
-
23
-
24
-
25
-
26
-
27
-
28
-
29
-
30
-
31
-
32
-
33
-
34
-
35
-
36
-
37
-
38
-
39
-
40
-
41
-
42
-
43
-
44
-
45
-
46
-
47
-
48
-
49
-
50
-
51
-
52
-
53
-
54
-
55
-
56
-
57
-
58
-
59
-
60
-
61
-
62
-
63
-
64
-
65
-
66
-
67
-
68
-
69
-
70
-
71
-
72
-
73
-
74
-
75
-
76
-
77
-
78
-
79
-
80
-
81
-
82
-
83
-
84
-
85
-
86
-
87
-
88
-
89
-
90
-
91
-
92
-
93
-
94
-
95
-
96
-
97
-
98
-
99
-
100
-
101
-
102
-
103
-
104
-
105
-
106
-
107
-
108
-
109
-
110
-
111
-
112
-
113
-
114
-
115
-
116
-
117
-
118
-
119
-
120
-
121
-
122
-
123
-
124
-
125
-
126
-
127
-
128
-
129
-
130
-
131
-
132
-
133
-
134
-
135
-
136
-
137
-
138
-
139
-
140
-
141
-
142
-
143
-
144
-
145
-
146
-
147
-
148
-
149
-
150
-
151
-
152
-
153
-
154
-
155
-
156
-
157
-
158
-
159
-
160
-
161
-
162
-
163
-
164
-
165
-
166
-
167
-
168
-
169
-
170
-
171
-
172
-
173
-
174
-
175
-
176
-
177
-
178
-
179
-
180
-
181
-
182
-
183
-
184
-
185
-
186
-
187
-
188
-
189
-
190
-
191
-
192
-
193
-
194
-
195
-
196
-
197
-
198
-
199
-
200
-
201
-
202
-
203
-
204
-
205
-
206
-
207
-
208
-
209
-
210
-
211
-
212
-
213
-
214
-
215
-
216
-
217
-
218
-
219
-
220
-
221
-
222
-
223
-
224
-
225
-
226
-
227
-
228
-
229
-
230
-
231
-
232
-
233
-
 234
234 -
 235
235 -
 236
236 -
 237
237 -
 238
238 -
 239
239 -
 240
240 -
 241
241 -
 242
242 -
 243
243 -
 244
244 -
 245
245 -
 246
246 -
 247
247 -
 248
248 -
 249
249 -
 250
250 -
 251
251 -
 252
252 -
 253
253 -
 254
254 -
255
-
256
-
257
-
258
-
259
-
260
-
261
-
262
-
263
-
264
-
265
-
266
-
267
-
268
-
269
-
270
-
271
-
272
-
273
-
274
-
275
-
276
-
277
-
278
-
279
-
280
-
281
-
282
-
283
-
284
-
285
-
286
-
287
-
288
-
289
-
290
-
291
-
292
-
293
-
294
-
295
-
296
-
297
-
298
-
299
-
300
-
301
-
302
-
303
 |
 |

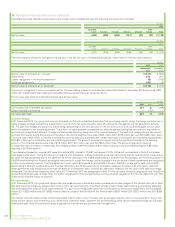
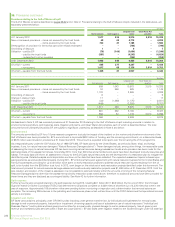
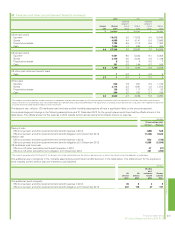
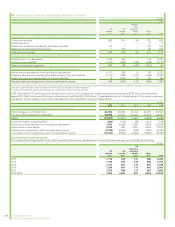
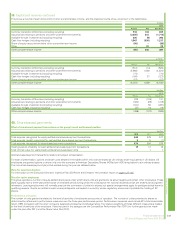
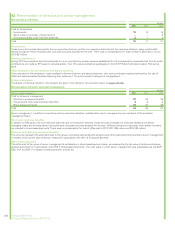
37. Pensions and other post-retirement benefits continued
$ million
2012
UK
pension
plans
US
pension
plans
US other
post-
retirement
benefit
plans
Other
plans Total
Analysis of the amount charged to profit before interest and taxation
Current service costa477 328 51 150 1,006
Past service cost – 20 – 12 32
Settlement, curtailment and special termination benefits (1) – – 71 70
Payments to defined contribution plans 14 223 – 44 281
Total operating chargeb490 571 51 277 1,389
Analysis of the amount credited (charged) to other finance expense
Expected return on plan assets 1,680 524 – 163 2,367
Interest on plan liabilities (1,249) (382) (134) (401) (2,166)
Other finance income (expense) 431 142 (134) (238) 201
Analysis of the amount recognized in other comprehensive income
Actual return less expected return on pension plan assets 989 498 – 164 1,651
Change in assumptions underlying the present value of the plan liabilities (1,446) (1,427) 239 (1,130) (3,764)
Experience gains and losses arising on the plan liabilities (116) 68 (48) (126) (222)
Actuarial (loss) gain recognized in other comprehensive income (573) (861) 191 (1,092) (2,335)
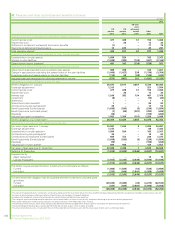
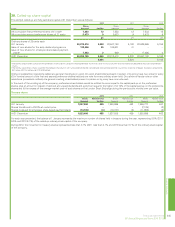
Movements in benefit obligation during the year
Benefit obligation at 1 January 25,675 8,617 3,061 8,729 46,082
Exchange adjustments 1,313 – – 251 1,564
Current service costa477 328 51 150 1,006
Past service cost – 20 – 12 32
Interest cost 1,249 382 134 401 2,166
Curtailment (8) – – (15) (23)
Settlement –– –11
Special termination benefitsc7– –8592
Contributions by plan participantsd39 – – 14 53
Benefit payments (funded plans)e(1,038) (593) (3) (230) (1,864)
Benefit payments (unfunded plans)e(7) (84) (207) (392) (690)
Disposals (10) – – (192) (202)
Actuarial loss (gain) on obligation 1,562 1,359 (191) 1,256 3,986
Benefit obligation at 31 Decemberaf 29,259 10,029 2,845 10,070 52,203
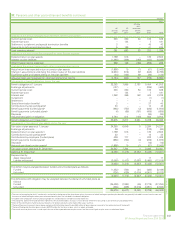
Movements in fair value of plan assets during the year
Fair value of plan assets at 1 January 23,587 7,204 4 3,286 34,081
Exchange adjustments 1,215 – – 88 1,303
Expected return on plan assetsag 1,680 524 – 163 2,367
Contributions by plan participantsd39 – – 14 53
Contributions by employers (funded plans) 884 153 – 238 1,275
Benefit payments (funded plans)e(1,038) (593) (3) (230) (1,864)
Disposals (10) – – (190) (200)
Actuarial gain on plan assetsg989 498 – 164 1,651
Fair value of plan assets at 31 December 27,346 7,786 1 3,533 38,666
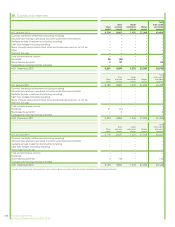
Deficit at 31 December (1,913) (2,243) (2,844) (6,537) (13,537)
Represented by
Asset recognized –– –1212
Liability recognized (1,913) (2,243) (2,844) (6,549) (13,549)
(1,913) (2,243) (2,844) (6,537) (13,537)
The deficit may be analysed between funded and unfunded plans as follows
Funded (1,688) (1,599) (43) (539) (3,869)
Unfunded (225) (644) (2,801) (5,998) (9,668)
(1,913) (2,243) (2,844) (6,537) (13,537)
The defined benefit obligation may be analysed between funded and unfunded plans
as follows
Funded (29,034) (9,385) (44) (4,072) (42,535)
Unfunded (225) (644) (2,801) (5,998) (9,668)
(29,259) (10,029) (2,845) (10,070) (52,203)
aThe costs of managing the plan’s investments are treated as being part of the investment return, the costs of administering our pension plan benefits are generally included in current service cost and
the costs of administering our other post-retirement benefit plans are included in the benefit obligation.
bIncluded within production and manufacturing expenses and distribution and administration expenses.
cThe charge for special termination benefits represents the increased liability arising as a result of early retirements occurring as part of restructuring programmes.
dMost of the contributions made by plan participants into UK pension plans were made under salary sacrifice.
eThe benefit payments amount shown above comprises $2,499 million benefits plus $55 million of plan expenses incurred in the administration of the benefit.
fThe benefit obligation for other plans includes $4,705 million for the German plan, which is largely unfunded.
gThe actual return on plan assets is made up of the sum of the expected return on plan assets and the actuarial gain on plan assets as disclosed above.
242 Financial statements
BP Annual Report and Form 20-F 2012