BP 2012 Annual Report Download - page 296
Download and view the complete annual report
Please find page 296 of the 2012 BP annual report below. You can navigate through the pages in the report by either clicking on the pages listed below, or by using the keyword search tool below to find specific information within the annual report.-
 1
1 -
2
-
3
-
4
-
5
-
6
-
7
-
8
-
9
-
10
-
11
-
12
-
13
-
14
-
15
-
16
-
17
-
18
-
19
-
20
-
21
-
22
-
23
-
24
-
25
-
26
-
27
-
28
-
29
-
30
-
31
-
32
-
33
-
34
-
35
-
36
-
37
-
38
-
39
-
40
-
41
-
42
-
43
-
44
-
45
-
46
-
47
-
48
-
49
-
50
-
51
-
52
-
53
-
54
-
55
-
56
-
57
-
58
-
59
-
60
-
61
-
62
-
63
-
64
-
65
-
66
-
67
-
68
-
69
-
70
-
71
-
72
-
73
-
74
-
75
-
76
-
77
-
78
-
79
-
80
-
81
-
82
-
83
-
84
-
85
-
86
-
87
-
88
-
89
-
90
-
91
-
92
-
93
-
94
-
95
-
96
-
97
-
98
-
99
-
100
-
101
-
102
-
103
-
104
-
105
-
106
-
107
-
108
-
109
-
110
-
111
-
112
-
113
-
114
-
115
-
116
-
117
-
118
-
119
-
120
-
121
-
122
-
123
-
124
-
125
-
126
-
127
-
128
-
129
-
130
-
131
-
132
-
133
-
134
-
135
-
136
-
137
-
138
-
139
-
140
-
141
-
142
-
143
-
144
-
145
-
146
-
147
-
148
-
149
-
150
-
151
-
152
-
153
-
154
-
155
-
156
-
157
-
158
-
159
-
160
-
161
-
162
-
163
-
164
-
165
-
166
-
167
-
168
-
169
-
170
-
171
-
172
-
173
-
174
-
175
-
176
-
177
-
178
-
179
-
180
-
181
-
182
-
183
-
184
-
185
-
186
-
187
-
188
-
189
-
190
-
191
-
192
-
193
-
194
-
195
-
196
-
197
-
198
-
199
-
200
-
201
-
202
-
203
-
204
-
205
-
206
-
207
-
208
-
209
-
210
-
211
-
212
-
213
-
214
-
215
-
216
-
217
-
218
-
219
-
220
-
221
-
222
-
223
-
224
-
225
-
226
-
227
-
228
-
229
-
230
-
231
-
232
-
233
-
234
-
235
-
236
-
237
-
238
-
239
-
240
-
241
-
242
-
243
-
244
-
245
-
246
-
247
-
248
-
249
-
250
-
251
-
252
-
253
-
254
-
255
-
256
-
257
-
258
-
259
-
260
-
261
-
262
-
263
-
264
-
265
-
266
-
267
-
268
-
269
-
270
-
271
-
272
-
273
-
274
-
275
-
276
-
277
-
278
-
279
-
280
-
281
-
282
-
283
-
284
-
285
-
 286
286 -
 287
287 -
 288
288 -
 289
289 -
 290
290 -
 291
291 -
 292
292 -
 293
293 -
 294
294 -
 295
295 -
 296
296 -
 297
297 -
 298
298 -
 299
299 -
 300
300 -
 301
301 -
 302
302 -
 303
303
 |
 |

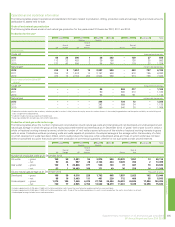
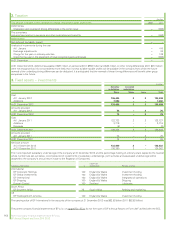
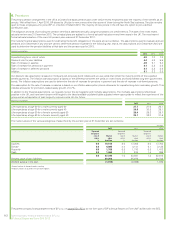
6. Pensions
The primary pension arrangement in the UK is a funded final salary pension plan under which retired employees draw the majority of their benefit as an
annuity. With effect from 1 April 2010, BP closed its UK plan to new joiners other than some of those joining the North Sea business. The plan remains
open to those employees who joined BP on or before 31 March 2010. The majority of new joiners in the UK have the option to join a defined
contribution plan.
The obligation and cost of providing the pension benefits is assessed annually using the projected unit credit method. The date of the most recent
actuarial review was 31 December 2012. The principal plans are subject to a formal actuarial valuation every three years in the UK. The most recent
formal actuarial valuation of the main UK pension plan was as at 31 December 2011.
The material financial assumptions used for estimating the benefit obligations of the plans are set out below. The assumptions used to evaluate accrued
pensions at 31 December in any year are used to determine pension expense for the following year, that is, the assumptions at 31 December 2012 are
used to determine the pension liabilities at that date and the pension cost for 2013.
Financial assumptions %
2012 2011 2010
Expected long-term rate of return 6.9 7.0 7.3
Discount rate for plan liabilities 4.4 4.8 5.5
Rate of increase in salaries 4.9 5.1 5.4
Rate of increase for pensions in payment 3.1 3.2 3.5
Rate of increase in deferred pensions 3.1 3.2 3.5
Inflation 3.1 3.2 3.5
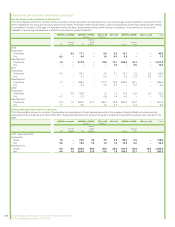
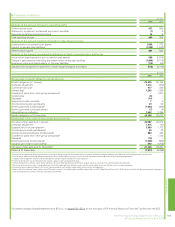
Our discount rate assumption is based on third-party AA corporate bond indices and we use yields that reflect the maturity profile of the expected
benefit payments. The inflation rate assumption is based on the difference between the yields on index-linked and fixed-interest long-term government
bonds. The inflation assumptions are used to determine the rate of increase for pensions in payment and the rate of increase in deferred pensions.
Our assumption for the rate of increase in salaries is based on our inflation assumption plus an allowance for expected long-term real salary growth. This
includes allowance for promotion-related salary growth of 0.7%.
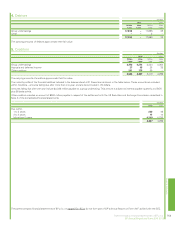
In addition to the financial assumptions, we regularly review the demographic and mortality assumptions. The mortality assumptions reflect best
practice in the UK, and have been chosen with regard to the latest available published tables adjusted where appropriate to reflect the experience of the
group and an extrapolation of past longevity improvements into the future.
Mortality assumptions
2012 2011 2010
Life expectancy at age 60 for a male currently aged 60 27.7 27.6 26.1
Life expectancy at age 60 for a male currently aged 40 30.6 30.5 29.1
Life expectancy at age 60 for a female currently aged 60 29.4 29.3 28.7
Life expectancy at age 60 for a female currently aged 40 32.1 32.0 31.6
The market values of the various categories of asset held by the pension plan at 31 December are set out below.
$ million
2012 2011 2010
Expected
long-term
rate of
return
%
Market
value
$ million
Expected
long-term
rate of
return
%
Market
value
$ million
Expected
long-term
rate of
return
%
Market
value
$ million
Equities 8.0 19,612 8.0 17,202 8.0 17,703
Bondsa3.8 4,885 4.4 4,141 5.1 3,128
Propertyb6.5 1,783 6.5 1,710 6.5 1,412
Cash 0.9 1,066 1.7 534 1.4 369
6.9 27,346 7.0 23,587 7.3 22,612
Present value of plan liabilities 29,259 25,675 20,742
(Deficit) surplus in the plan (1,913) (2,088) 1,870
aBonds held are all denominated in sterling.
bProperty held is all located in the United Kingdom.
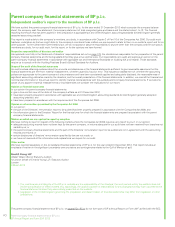
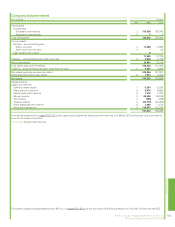
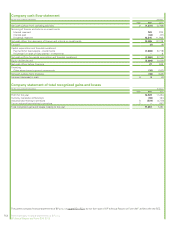
PC7 Parent company financial statements of BP p.l.c.
BP Annual Report and Form 20-F 2012
The parent company financial statements of BP p.l.c. on pages PC1–PC11 do not form part of BP’s Annual Report on Form 20-F as filed with the SEC.