BP 2012 Annual Report Download - page 263
Download and view the complete annual report
Please find page 263 of the 2012 BP annual report below. You can navigate through the pages in the report by either clicking on the pages listed below, or by using the keyword search tool below to find specific information within the annual report.-
 1
1 -
2
-
3
-
4
-
5
-
6
-
7
-
8
-
9
-
10
-
11
-
12
-
13
-
14
-
15
-
16
-
17
-
18
-
19
-
20
-
21
-
22
-
23
-
24
-
25
-
26
-
27
-
28
-
29
-
30
-
31
-
32
-
33
-
34
-
35
-
36
-
37
-
38
-
39
-
40
-
41
-
42
-
43
-
44
-
45
-
46
-
47
-
48
-
49
-
50
-
51
-
52
-
53
-
54
-
55
-
56
-
57
-
58
-
59
-
60
-
61
-
62
-
63
-
64
-
65
-
66
-
67
-
68
-
69
-
70
-
71
-
72
-
73
-
74
-
75
-
76
-
77
-
78
-
79
-
80
-
81
-
82
-
83
-
84
-
85
-
86
-
87
-
88
-
89
-
90
-
91
-
92
-
93
-
94
-
95
-
96
-
97
-
98
-
99
-
100
-
101
-
102
-
103
-
104
-
105
-
106
-
107
-
108
-
109
-
110
-
111
-
112
-
113
-
114
-
115
-
116
-
117
-
118
-
119
-
120
-
121
-
122
-
123
-
124
-
125
-
126
-
127
-
128
-
129
-
130
-
131
-
132
-
133
-
134
-
135
-
136
-
137
-
138
-
139
-
140
-
141
-
142
-
143
-
144
-
145
-
146
-
147
-
148
-
149
-
150
-
151
-
152
-
153
-
154
-
155
-
156
-
157
-
158
-
159
-
160
-
161
-
162
-
163
-
164
-
165
-
166
-
167
-
168
-
169
-
170
-
171
-
172
-
173
-
174
-
175
-
176
-
177
-
178
-
179
-
180
-
181
-
182
-
183
-
184
-
185
-
186
-
187
-
188
-
189
-
190
-
191
-
192
-
193
-
194
-
195
-
196
-
197
-
198
-
199
-
200
-
201
-
202
-
203
-
204
-
205
-
206
-
207
-
208
-
209
-
210
-
211
-
212
-
213
-
214
-
215
-
216
-
217
-
218
-
219
-
220
-
221
-
222
-
223
-
224
-
225
-
226
-
227
-
228
-
229
-
230
-
231
-
232
-
233
-
234
-
235
-
236
-
237
-
238
-
239
-
240
-
241
-
242
-
243
-
244
-
245
-
246
-
247
-
248
-
249
-
250
-
251
-
252
-
 253
253 -
 254
254 -
 255
255 -
 256
256 -
 257
257 -
 258
258 -
 259
259 -
 260
260 -
 261
261 -
 262
262 -
 263
263 -
 264
264 -
 265
265 -
 266
266 -
 267
267 -
 268
268 -
 269
269 -
 270
270 -
 271
271 -
 272
272 -
 273
273 -
274
-
275
-
276
-
277
-
278
-
279
-
280
-
281
-
282
-
283
-
284
-
285
-
286
-
287
-
288
-
289
-
290
-
291
-
292
-
293
-
294
-
295
-
296
-
297
-
298
-
299
-
300
-
301
-
302
-
303
 |
 |

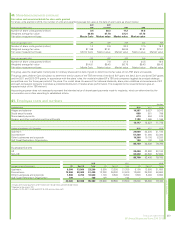
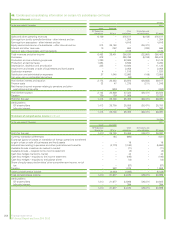
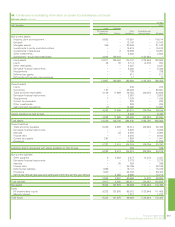
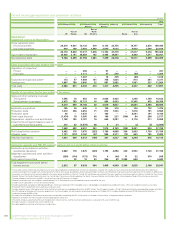
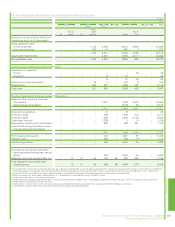
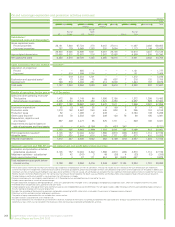
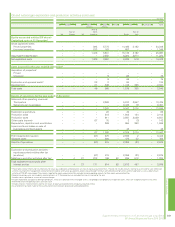
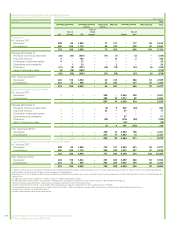
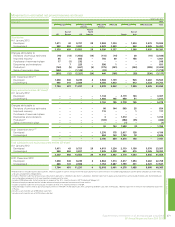
Balance sheet continued
$ million
At 31 December 2011
Issuer Guarantor
BP Exploration
(Alaska) Inc. BP p.l.c.
Other
subsidiaries
Eliminations and
reclassifications BP group
Non-current assets
Property, plant and equipment 8,653 – 110,561 – 119,214
Goodwill – – 12,100 – 12,100
Intangible assets 456 – 20,646 – 21,102
Investments in jointly controlled entities – – 15,518 – 15,518
Investments in associates – 2 13,289 – 13,291
Other investments – – 2,633 – 2,633
Subsidiaries – equity-accounted basis 4,802 129,042 – (133,844) –
Fixed assets 13,911 129,044 174,747 (133,844) 183,858
Loans 46 38 5,113 (4,313) 884
Other receivables – – 4,337 – 4,337
Derivative financial instruments – – 5,038 – 5,038
Prepayments – – 739 – 739
Deferred tax assets – – 611 – 611
Defined benefit pension plan surpluses – – 17 – 17
13,957 129,082 190,602 (138,157) 195,484
Current assets
Loans – – 244 – 244
Inventories 167 – 25,494 – 25,661
Trade and other receivables 4,109 17,698 49,753 (28,034) 43,526
Derivative financial instruments – – 3,857 – 3,857
Prepayments 7 – 1,279 – 1,286
Current tax receivable – – 235 – 235
Other investments – – 288 – 288
Cash and cash equivalents (1) – 14,068 – 14,067
4,282 17,698 95,218 (28,034) 89,164
Assets classified as held for sale – – 8,420 – 8,420
4,282 17,698 103,638 (28,034) 97,584
Total assets 18,239 146,780 294,240 (166,191) 293,068
Current liabilities
Trade and other payables 5,035 2,390 73,014 (28,034) 52,405
Derivative financial instruments – – 3,220 – 3,220
Accruals – 28 5,904 – 5,932
Finance debt – – 9,044 – 9,044
Current tax payable 287 – 1,654 – 1,941
Provisions – – 11,238 – 11,238
5,322 2,418 104,074 (28,034) 83,780
Liabilities directly associated with assets classified as held for sale – – 538 – 538
5,322 2,418 104,612 (28,034) 84,318
Non-current liabilities
Other payables 9 4,264 3,477 (4,313) 3,437
Derivative financial instruments – – 3,773 – 3,773
Accruals – 35 354 – 389
Finance debt – – 35,169 – 35,169
Deferred tax liabilities 1,966 – 13,112 – 15,078
Provisions 1,620 – 24,784 – 26,404
Defined benefit pension plan and other post-retirement benefit plan deficits – 2,088 9,930 – 12,018
3,595 6,387 90,599 (4,313) 96,268
Total liabilities 8,917 8,805 195,211 (32,347) 180,586
Net assets 9,322 137,975 99,029 (133,844) 112,482
Equity
BP shareholders’ equity 9,322 137,975 98,012 (133,844) 111,465
Minority interest – – 1,017 – 1,017
Total equity 9,322 137,975 99,029 (133,844) 112,482
Financial statements 261
BP Annual Report and Form 20-F 2012
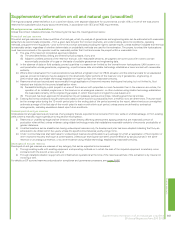
Financial statements
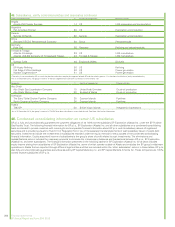
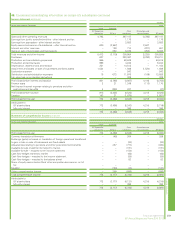
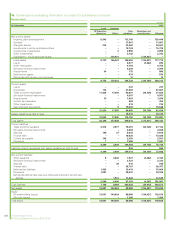
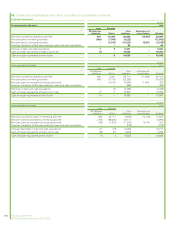
46. Condensed consolidating information on certain US subsidiaries continued