BP 2012 Annual Report Download - page 283
Download and view the complete annual report
Please find page 283 of the 2012 BP annual report below. You can navigate through the pages in the report by either clicking on the pages listed below, or by using the keyword search tool below to find specific information within the annual report.-
 1
1 -
2
-
3
-
4
-
5
-
6
-
7
-
8
-
9
-
10
-
11
-
12
-
13
-
14
-
15
-
16
-
17
-
18
-
19
-
20
-
21
-
22
-
23
-
24
-
25
-
26
-
27
-
28
-
29
-
30
-
31
-
32
-
33
-
34
-
35
-
36
-
37
-
38
-
39
-
40
-
41
-
42
-
43
-
44
-
45
-
46
-
47
-
48
-
49
-
50
-
51
-
52
-
53
-
54
-
55
-
56
-
57
-
58
-
59
-
60
-
61
-
62
-
63
-
64
-
65
-
66
-
67
-
68
-
69
-
70
-
71
-
72
-
73
-
74
-
75
-
76
-
77
-
78
-
79
-
80
-
81
-
82
-
83
-
84
-
85
-
86
-
87
-
88
-
89
-
90
-
91
-
92
-
93
-
94
-
95
-
96
-
97
-
98
-
99
-
100
-
101
-
102
-
103
-
104
-
105
-
106
-
107
-
108
-
109
-
110
-
111
-
112
-
113
-
114
-
115
-
116
-
117
-
118
-
119
-
120
-
121
-
122
-
123
-
124
-
125
-
126
-
127
-
128
-
129
-
130
-
131
-
132
-
133
-
134
-
135
-
136
-
137
-
138
-
139
-
140
-
141
-
142
-
143
-
144
-
145
-
146
-
147
-
148
-
149
-
150
-
151
-
152
-
153
-
154
-
155
-
156
-
157
-
158
-
159
-
160
-
161
-
162
-
163
-
164
-
165
-
166
-
167
-
168
-
169
-
170
-
171
-
172
-
173
-
174
-
175
-
176
-
177
-
178
-
179
-
180
-
181
-
182
-
183
-
184
-
185
-
186
-
187
-
188
-
189
-
190
-
191
-
192
-
193
-
194
-
195
-
196
-
197
-
198
-
199
-
200
-
201
-
202
-
203
-
204
-
205
-
206
-
207
-
208
-
209
-
210
-
211
-
212
-
213
-
214
-
215
-
216
-
217
-
218
-
219
-
220
-
221
-
222
-
223
-
224
-
225
-
226
-
227
-
228
-
229
-
230
-
231
-
232
-
233
-
234
-
235
-
236
-
237
-
238
-
239
-
240
-
241
-
242
-
243
-
244
-
245
-
246
-
247
-
248
-
249
-
250
-
251
-
252
-
253
-
254
-
255
-
256
-
257
-
258
-
259
-
260
-
261
-
262
-
263
-
264
-
265
-
266
-
267
-
268
-
269
-
270
-
271
-
272
-
 273
273 -
 274
274 -
 275
275 -
 276
276 -
 277
277 -
 278
278 -
 279
279 -
 280
280 -
 281
281 -
 282
282 -
 283
283 -
 284
284 -
 285
285 -
 286
286 -
 287
287 -
 288
288 -
 289
289 -
 290
290 -
 291
291 -
 292
292 -
 293
293 -
294
-
295
-
296
-
297
-
298
-
299
-
300
-
301
-
302
-
303
 |
 |

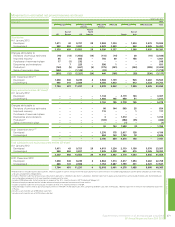
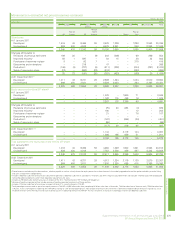
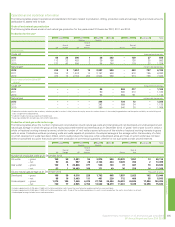
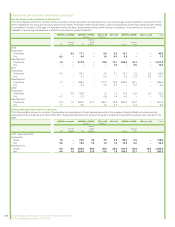
million barrels of oil equivalentb
Total hydrocarbonsa2010
Europe North
America
South
America
Africa Asia Australasia Total
UK
Rest of
Europe USc
Rest of
North
America Russia
Rest of
Asia
Subsidiaries
At 1 January 2010
Developed 680 91 3,514 135 596 613 – 455 612 6,696
Undeveloped 406 253 2,183 79 1,331 704 – 376 593 5,925
1,086 344 5,697 214 1,927 1,317 – 831 1,205 12,621
Changes attributable to
Revisions of previous estimates 18 2 (364) (2) (1) (61) – (87) (33) (528)
Improved recovery 126 10 276 – 105 17 – 160 13 707
Purchases of reserves-in-place – 38 22 – – – – 41 – 101
Discoveries and extensions 36 1 207 2 4 257 – – – 507
Productiondef (83) (16) (359) (15) (183) (127) – (83) (61) (927)
Sales of reserves-in-place (1) – (190) (189) – (24) – – – (404)
96 35 (408) (204) (75) 62 – 31 (81) (544)
At 31 December 2010gh
Developed 608 84 3,366 10 660 600 – 491 662 6,481
Undeveloped 574 295 1,923 – 1,192 779 – 371 462 5,596
1,182 379 5,289 10 1,852 1,379 – 862 1,124 12,077
Equity-accounted entities (BP share)i
At 1 January 2010
Developed – – – – 623 – 2,645 377 – 3,645
Undeveloped – – – – 580 37 1,287 122 – 2,026
– – – – 1,203 37 3,932 499 – 5,671
Changes attributable to
Revisions of previous estimates – – – – (20) 6 314 (19) – 281
Improved recovery – – – – 83 – 269 2 – 354
Purchases of reserves-in-place – – – – – – – – – –
Discoveries and extensions – – – 179 4 – – – – 183
Productionde – – – – (64)jk – (354) (73) – (491)
Sales of reserves-in-place – – – – – – (4) – – (4)
– – – 179 3 6 225 (90) – 323
At 31 December 2010l
Developed – – – – 593 – 2,716 382 – 3,691
Undeveloped – – – 179 613 43 1,441 27 – 2,303
– – – 179 1,206m43 4,157 409 – 5,994
Total subsidiaries and equity-accounted entities (BP share)n
At 1 January 2010
Developed 680 91 3,514 135 1,219 613 2,645 832 612 10,341
Undeveloped 406 253 2,183 79 1,911 741 1,287 498 593 7,951
1,086 344 5,697 214 3,130 1,354 3,932 1,330 1,205 18,292
At 31 December 2010
Developed 608 84 3,366 10 1,253 600 2,716 873 662 10,172
Undeveloped 574 295 1,923 179 1,805 822 1,441 398 462 7,899
1,182 379 5,289 189 3,058 1,422 4,157 1,271 1,124 18,071
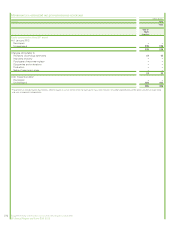
aProved reserves exclude royalties due to others, whether payable in cash or in kind, where the royalty owner has a direct interest in the underlying production and the option and ability to make lifting
and sales arrangements independently.
b5.8 billion cubic feet of natural gas = 1 million barrels of oil equivalent.
cProved reserves in the Prudhoe Bay field in Alaska include an estimated 78 million barrels of oil equivalent upon which a net profits royalty will be payable, over the life of the field under the terms of the
BP Prudhoe Bay Royalty Trust.
dExcludes NGLs from processing plants in which an interest is held of 29 thousand barrels of oil equivalent a day.
eIncludes 35 million barrels of oil equivalent of natural gas consumed in operations, 28 million barrels of oil equivalent in subsidiaries, 7 million barrels of oil equivalent in equity-accounted entities and
excludes 2 million barrels of oil equivalent of produced non-hydrocarbon components which meet regulatory requirements for sales.
fIncludes 38 million barrels of oil equivalent (excluding gas consumed in operations) relating to production from assets held for sale at 31 December 2010. Amounts by region are: 6 million barrels of oil
equivalent in US; 11 million barrels of oil equivalent in South America; and 21 million barrels of oil equivalent in Rest of Asia.
gIncludes 643 million barrels of NGLs. Also includes 526 million barrels of oil equivalent in respect of the 30% minority interest in BP Trinidad and Tobago LLC.
hIncludes 197 million barrels of oil equivalent relating to assets held for sale at 31 December 2010. Amounts by region are: 34 million barrels of oil equivalent in US; 64 million barrels of oil equivalent in
South America; and 99 million barrels of oil equivalent in Rest of Asia.
iVolumes of equity-accounted entities include volumes of equity-accounted investments of those entities.
jIncludes 2 million barrels of oil equivalent sold relating to production since classification of equity-accounted entities as held for sale.
kIncludes 9 million barrels of oil equivalent (excluding gas consumed in operations) relating to production from assets held for sale at 31 December 2010.
lIncludes 18 million barrels of NGLs. Also includes 278 million barrels of oil equivalent in respect of the minority interest in TNK-BP.
mIncludes 222 million barrels of oil equivalent relating to assets held for sale at 31 December 2010.
nIncludes 1,311 million barrels of oil equivalent (197 million barrels of oil equivalent for subsidiaries and 1,114 million barrels of oil equivalent for equity-accounted entities) associated with properties
currently held for sale where the disposal has not yet been completed.
Supplementary information on oil and natural gas (unaudited) 281
BP Annual Report and Form 20-F 2012
Financial statements
Movements in estimated net proved reserves continued