BP 2012 Annual Report Download - page 267
Download and view the complete annual report
Please find page 267 of the 2012 BP annual report below. You can navigate through the pages in the report by either clicking on the pages listed below, or by using the keyword search tool below to find specific information within the annual report.-
 1
1 -
2
-
3
-
4
-
5
-
6
-
7
-
8
-
9
-
10
-
11
-
12
-
13
-
14
-
15
-
16
-
17
-
18
-
19
-
20
-
21
-
22
-
23
-
24
-
25
-
26
-
27
-
28
-
29
-
30
-
31
-
32
-
33
-
34
-
35
-
36
-
37
-
38
-
39
-
40
-
41
-
42
-
43
-
44
-
45
-
46
-
47
-
48
-
49
-
50
-
51
-
52
-
53
-
54
-
55
-
56
-
57
-
58
-
59
-
60
-
61
-
62
-
63
-
64
-
65
-
66
-
67
-
68
-
69
-
70
-
71
-
72
-
73
-
74
-
75
-
76
-
77
-
78
-
79
-
80
-
81
-
82
-
83
-
84
-
85
-
86
-
87
-
88
-
89
-
90
-
91
-
92
-
93
-
94
-
95
-
96
-
97
-
98
-
99
-
100
-
101
-
102
-
103
-
104
-
105
-
106
-
107
-
108
-
109
-
110
-
111
-
112
-
113
-
114
-
115
-
116
-
117
-
118
-
119
-
120
-
121
-
122
-
123
-
124
-
125
-
126
-
127
-
128
-
129
-
130
-
131
-
132
-
133
-
134
-
135
-
136
-
137
-
138
-
139
-
140
-
141
-
142
-
143
-
144
-
145
-
146
-
147
-
148
-
149
-
150
-
151
-
152
-
153
-
154
-
155
-
156
-
157
-
158
-
159
-
160
-
161
-
162
-
163
-
164
-
165
-
166
-
167
-
168
-
169
-
170
-
171
-
172
-
173
-
174
-
175
-
176
-
177
-
178
-
179
-
180
-
181
-
182
-
183
-
184
-
185
-
186
-
187
-
188
-
189
-
190
-
191
-
192
-
193
-
194
-
195
-
196
-
197
-
198
-
199
-
200
-
201
-
202
-
203
-
204
-
205
-
206
-
207
-
208
-
209
-
210
-
211
-
212
-
213
-
214
-
215
-
216
-
217
-
218
-
219
-
220
-
221
-
222
-
223
-
224
-
225
-
226
-
227
-
228
-
229
-
230
-
231
-
232
-
233
-
234
-
235
-
236
-
237
-
238
-
239
-
240
-
241
-
242
-
243
-
244
-
245
-
246
-
247
-
248
-
249
-
250
-
251
-
252
-
253
-
254
-
255
-
256
-
 257
257 -
 258
258 -
 259
259 -
 260
260 -
 261
261 -
 262
262 -
 263
263 -
 264
264 -
 265
265 -
 266
266 -
 267
267 -
 268
268 -
 269
269 -
 270
270 -
 271
271 -
 272
272 -
 273
273 -
 274
274 -
 275
275 -
 276
276 -
 277
277 -
278
-
279
-
280
-
281
-
282
-
283
-
284
-
285
-
286
-
287
-
288
-
289
-
290
-
291
-
292
-
293
-
294
-
295
-
296
-
297
-
298
-
299
-
300
-
301
-
302
-
303
 |
 |

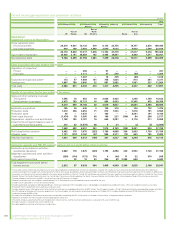
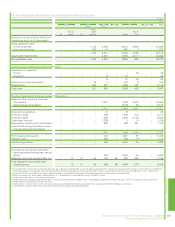
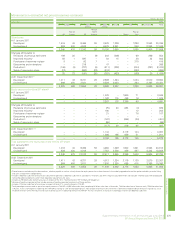
$ million
2012
Europe North
America
South
America
Africa Asia Australasia Total
UK
Rest of
Europe US
Rest of
North
America Russiag
Rest of
Asia
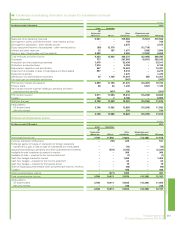
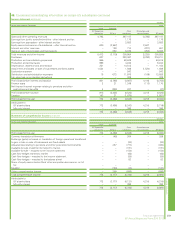
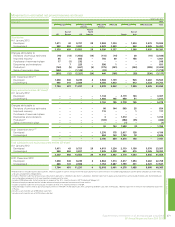
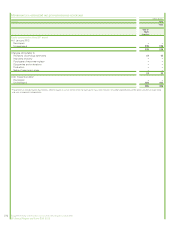
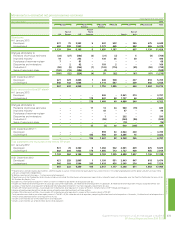
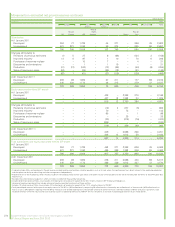
Equity-accounted entities (BP share)a
Capitalized costs at 31 Decemberb
Gross capitalized costs
Proved properties — — — 1,694 6,958 — — 4,036 — 12,688
Unproved properties — — — 583 21 — — 16 — 620
— — — 2,277 6,979 — — 4,052 — 13,308
Accumulated depreciation — — — — 2,965 — — 3,648 — 6,613
Net capitalized costs — — — 2,277 4,014 — — 404 — 6,695
Costs incurred for the year ended 31 Decemberb
Acquisition of propertiesc
Proved ———— ——4— —4
Unproved — — — — 439 — 15 — — 454
— — — — 439 — 19 — — 458
Exploration and appraisal costsd— — — 31 31 — 195 7 — 264
Development — — — 568 599 — 1,560 556 — 3,283
Total costs — — — 599 1,069 — 1,774 563 — 4,005
Results of operations for the year ended 31 December
Sales and other operating revenuese
Third parties — — — — 2,267 — 6,472 4,245 — 12,984
Sales between businesses — — — — — — 3,639 21 — 3,660
— — — — 2,267 — 10,111 4,266 — 16,644
Exploration expenditure — — — — 31 — 93 1 — 125
Production costs — — — — 555 — 1,605 295 — 2,455
Production taxes — — — — 959 — 4,400 3,245 — 8,604
Other costs (income) — — — (43) (11) — (24) (2) — (80)
Depreciation, depletion and amortization — — — — 328 — 786 538 — 1,652
Impairments and losses on sale of
businesses and fixed assets — — — — — — (27) — — (27)
— — — (43) 1,862 — 6,833 4,077 — 12,729
Profit (loss) before taxation — — — 43 405 — 3,278 189 — 3,915
Allocable taxes — — — — 294 — 536 54 — 884
Results of operations — — — 43 111 — 2,742 135 — 3,031
Exploration and production activities –
equity-accounted entities after tax (as
above) — — — 43 111 — 2,742 135 — 3,031
Midstream and other activities after taxf— 35 16 — 145 48 263 505 — 1,012
Total replacement cost profit after interest
and tax — 35 16 43 256 48 3,005 640 — 4,043
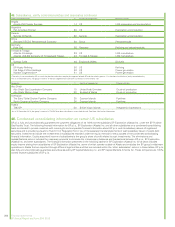
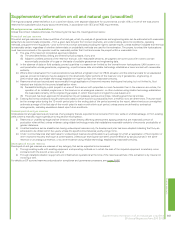
aThese tables contain information relating to oil and natural gas exploration and production activities of equity-accounted entities. Midstream activities relating to the management and ownership of crude
oil and natural gas pipelines, processing and export terminals and LNG processing facilities and transportation as well as downstream activities of TNK-BP are excluded. The amounts reported for equity-
accounted entities exclude the corresponding amounts for their equity-accounted entities.
bDecommissioning assets are included in capitalized costs at 31 December but are excluded from costs incurred for the year. Capitalized costs exclude balances associated with assets held for sale.
cIncludes costs capitalized as a result of asset exchanges.
dIncludes exploration and appraisal drilling expenditures, which are capitalized within intangible assets, and geological and geophysical exploration costs, which are charged to income as incurred.
ePresented net of transportation costs and sales taxes.
fIncludes interest, minority interest and the net results of equity-accounted entities of equity-accounted entities, and excludes inventory holding gains and losses.
gThe Russia region includes BP’s equity accounted share of TNK-BP’s earnings. For 2012, equity accounted earnings are included until 21 October only, after which our investment was classified as an
asset held for sale and therefore equity accounting ceased. The amounts shown exclude BP’s share of costs incurred and results of operations for the period 22 October to 31 December 2012.
Supplementary information on oil and natural gas (unaudited) 265
BP Annual Report and Form 20-F 2012
Financial statements
Oil and natural gas exploration and production activities continued