BP 2012 Annual Report Download - page 88
Download and view the complete annual report
Please find page 88 of the 2012 BP annual report below. You can navigate through the pages in the report by either clicking on the pages listed below, or by using the keyword search tool below to find specific information within the annual report.-
 1
1 -
2
-
3
-
4
-
5
-
6
-
7
-
8
-
9
-
10
-
11
-
12
-
13
-
14
-
15
-
16
-
17
-
18
-
19
-
20
-
21
-
22
-
23
-
24
-
25
-
26
-
27
-
28
-
29
-
30
-
31
-
32
-
33
-
34
-
35
-
36
-
37
-
38
-
39
-
40
-
41
-
42
-
43
-
44
-
45
-
46
-
47
-
48
-
49
-
50
-
51
-
52
-
53
-
54
-
55
-
56
-
57
-
58
-
59
-
60
-
61
-
62
-
63
-
64
-
65
-
66
-
67
-
68
-
69
-
70
-
71
-
72
-
73
-
74
-
75
-
76
-
77
-
 78
78 -
 79
79 -
 80
80 -
 81
81 -
 82
82 -
 83
83 -
 84
84 -
 85
85 -
 86
86 -
 87
87 -
 88
88 -
 89
89 -
 90
90 -
 91
91 -
 92
92 -
 93
93 -
 94
94 -
 95
95 -
 96
96 -
 97
97 -
 98
98 -
99
-
100
-
101
-
102
-
103
-
104
-
105
-
106
-
107
-
108
-
109
-
110
-
111
-
112
-
113
-
114
-
115
-
116
-
117
-
118
-
119
-
120
-
121
-
122
-
123
-
124
-
125
-
126
-
127
-
128
-
129
-
130
-
131
-
132
-
133
-
134
-
135
-
136
-
137
-
138
-
139
-
140
-
141
-
142
-
143
-
144
-
145
-
146
-
147
-
148
-
149
-
150
-
151
-
152
-
153
-
154
-
155
-
156
-
157
-
158
-
159
-
160
-
161
-
162
-
163
-
164
-
165
-
166
-
167
-
168
-
169
-
170
-
171
-
172
-
173
-
174
-
175
-
176
-
177
-
178
-
179
-
180
-
181
-
182
-
183
-
184
-
185
-
186
-
187
-
188
-
189
-
190
-
191
-
192
-
193
-
194
-
195
-
196
-
197
-
198
-
199
-
200
-
201
-
202
-
203
-
204
-
205
-
206
-
207
-
208
-
209
-
210
-
211
-
212
-
213
-
214
-
215
-
216
-
217
-
218
-
219
-
220
-
221
-
222
-
223
-
224
-
225
-
226
-
227
-
228
-
229
-
230
-
231
-
232
-
233
-
234
-
235
-
236
-
237
-
238
-
239
-
240
-
241
-
242
-
243
-
244
-
245
-
246
-
247
-
248
-
249
-
250
-
251
-
252
-
253
-
254
-
255
-
256
-
257
-
258
-
259
-
260
-
261
-
262
-
263
-
264
-
265
-
266
-
267
-
268
-
269
-
270
-
271
-
272
-
273
-
274
-
275
-
276
-
277
-
278
-
279
-
280
-
281
-
282
-
283
-
284
-
285
-
286
-
287
-
288
-
289
-
290
-
291
-
292
-
293
-
294
-
295
-
296
-
297
-
298
-
299
-
300
-
301
-
302
-
303
 |
 |

Business review: BP in more depth
BP Annual Report and Form 20-F 2012
86
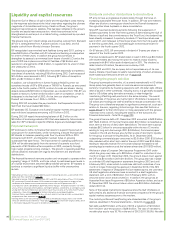
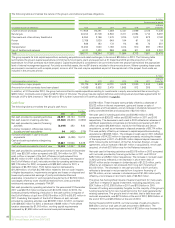
Proved reserves replacement
Total hydrocarbon proved reserves, on an oil equivalent basis including
equity-accounted entities, comprised 17,000mmboe (10,213mmboe
for subsidiaries and 6,787mmboe for equity-accounted entities) at
31 December 2012, a decrease of 4% (decrease of 11% for subsidiaries
and increase of 7% for equity-accounted entities) compared with the
31 December 2011 reserves of 17,748mmboe (11,426mmboe for
subsidiaries and 6,322mmboe for equity-accounted entities). Natural gas
represented about 41% (56% for subsidiaries and 18% for equity-accounted
entities) of these reserves. The change includes a net decrease from
acquisitions and disposals of 455mmboe (440mmboe net decrease for
subsidiaries and 15mmboe net decrease for equity-accounted entities).
Additions from acquisitions occurred principally in the US following a 2011
acquisition. Divestments occurred in Norway, Russia, Trinidad, the UK and
the US.
Proved reserves contain volumes in assets held for sale of 39 million
barrels of liquids and 590 billion cubic feet of natural gas (140 million
barrels of oil equivalent) in our subsidiaries and 4,540 million barrels of
liquids and 4,492 billion cubic feet of natural gas (5,315 million barrels of
oil equivalent) associated with TNK-BP.
The proved reserves replacement ratio is the extent to which production is
replaced by proved reserves additions. This ratio is expressed in oil
equivalent terms and includes changes resulting from revisions to
previous estimates, improved recovery, and extensions and discoveries.
For 2012, the proved reserves replacement ratio excluding acquisitions
and disposals was 77% (103% in 2011 and 106% in 2010) for subsidiaries
and equity-accounted entities, -5% for subsidiaries alone and 195% for
equity-accounted entities alone.
In 2012, net additions to the group’s proved reserves (excluding
production and sales and purchases of reserves-in-place) amounted to
953mmboe (-35mmboe for subsidiaries and 988mmboe for equity-
accounted entities), through revisions to previous estimates, improved
recovery from, and extensions to, existing fields and discoveries of new
fields. The subsidiary additions through improved recovery from, and
extensions to, existing fields and discoveries of new fields were in existing
developments where they represented a mixture of proved developed and
proved undeveloped reserves. Volumes added in 2012 principally resulted
from the application of conventional technologies. The principal proved
reserves additions in our subsidiaries were in Angola, Azerbaijan, India and
Trinidad. We had material proved reserves reductions in Norway and the
US due to price changes, changes in activity and performance updates.
The principal reserves additions in our equity-accounted entities were in
Angola, Argentina and Russia.
Twelve per cent of our proved reserves are associated with PSAs. The
countries in which we operated under PSAs in 2012 were Algeria, Angola,
Azerbaijan, Egypt, India, Indonesia, Oman, Vietnam and a non-material
volume in Trinidad. In addition, the technical service contract (TSC)
governing our investment in the Rumaila field in Iraq functions as a PSA.
The Abu Dhabi onshore concession expires in January 2014 with a
consequent reduction in production of approximately 140mb/d. The group
holds no other licences due to expire within the next three years that
would have a significant impact on BP’s reserves or production.
For further information on our reserves see page 263.