BP 2012 Annual Report Download - page 55
Download and view the complete annual report
Please find page 55 of the 2012 BP annual report below. You can navigate through the pages in the report by either clicking on the pages listed below, or by using the keyword search tool below to find specific information within the annual report.-
 1
1 -
2
-
3
-
4
-
5
-
6
-
7
-
8
-
9
-
10
-
11
-
12
-
13
-
14
-
15
-
16
-
17
-
18
-
19
-
20
-
21
-
22
-
23
-
24
-
25
-
26
-
27
-
28
-
29
-
30
-
31
-
32
-
33
-
34
-
35
-
36
-
37
-
38
-
39
-
40
-
41
-
42
-
43
-
44
-
 45
45 -
 46
46 -
 47
47 -
 48
48 -
 49
49 -
 50
50 -
 51
51 -
 52
52 -
 53
53 -
 54
54 -
 55
55 -
 56
56 -
 57
57 -
 58
58 -
 59
59 -
 60
60 -
 61
61 -
 62
62 -
 63
63 -
 64
64 -
 65
65 -
66
-
67
-
68
-
69
-
70
-
71
-
72
-
73
-
74
-
75
-
76
-
77
-
78
-
79
-
80
-
81
-
82
-
83
-
84
-
85
-
86
-
87
-
88
-
89
-
90
-
91
-
92
-
93
-
94
-
95
-
96
-
97
-
98
-
99
-
100
-
101
-
102
-
103
-
104
-
105
-
106
-
107
-
108
-
109
-
110
-
111
-
112
-
113
-
114
-
115
-
116
-
117
-
118
-
119
-
120
-
121
-
122
-
123
-
124
-
125
-
126
-
127
-
128
-
129
-
130
-
131
-
132
-
133
-
134
-
135
-
136
-
137
-
138
-
139
-
140
-
141
-
142
-
143
-
144
-
145
-
146
-
147
-
148
-
149
-
150
-
151
-
152
-
153
-
154
-
155
-
156
-
157
-
158
-
159
-
160
-
161
-
162
-
163
-
164
-
165
-
166
-
167
-
168
-
169
-
170
-
171
-
172
-
173
-
174
-
175
-
176
-
177
-
178
-
179
-
180
-
181
-
182
-
183
-
184
-
185
-
186
-
187
-
188
-
189
-
190
-
191
-
192
-
193
-
194
-
195
-
196
-
197
-
198
-
199
-
200
-
201
-
202
-
203
-
204
-
205
-
206
-
207
-
208
-
209
-
210
-
211
-
212
-
213
-
214
-
215
-
216
-
217
-
218
-
219
-
220
-
221
-
222
-
223
-
224
-
225
-
226
-
227
-
228
-
229
-
230
-
231
-
232
-
233
-
234
-
235
-
236
-
237
-
238
-
239
-
240
-
241
-
242
-
243
-
244
-
245
-
246
-
247
-
248
-
249
-
250
-
251
-
252
-
253
-
254
-
255
-
256
-
257
-
258
-
259
-
260
-
261
-
262
-
263
-
264
-
265
-
266
-
267
-
268
-
269
-
270
-
271
-
272
-
273
-
274
-
275
-
276
-
277
-
278
-
279
-
280
-
281
-
282
-
283
-
284
-
285
-
286
-
287
-
288
-
289
-
290
-
291
-
292
-
293
-
294
-
295
-
296
-
297
-
298
-
299
-
300
-
301
-
302
-
303
 |
 |

Business review: BP in more depth
Business review: BP in more depth
BP Annual Report and Form 20-F 2012
53
of more carbon-intensive conventional fuel sources to power operations at
sites where these energy sources are readily available and affordable. We
introduced ‘green completion’ technology in our North American gas
operations in 2001 to recover natural gas for sale and minimize the
amount of natural gas either flared or vented from our wells.
To help manage potential impacts on the community, such as increased
traffic, noise, dust and light, we seek to design and locate our equipment
and manage our work patterns in ways that reduce impact to relevant
communities. We also listen to suggestions or complaints from nearby
local communities and try to address their concerns.
More information about our approach to unconventional gas and hydraulic
fracturing may be found at bp.com/unconventionalgas.
Canada’s oil sands
Canada’s oil sands are believed to hold one of the world’s largest supplies
of oil, third in size to the resources in Saudi Arabia and Venezuela.
BP is involved in three oil sands properties, all of which are located in the
province of Alberta. Development of the Sunrise project, our joint venture
operated by Husky Energy, is under way, with production from Phase 1
expected to start in 2014. The other two proposed projects – Pike, which
will be operated by Devon Energy, and Terre de Grace, which will be
BP-operated – are still in the early stages of development.
Our decision to invest in Canadian oil sands projects takes into
consideration GHG emissions, impacts on land, water use and local
communities, and commercial viability. In the case of joint ventures in
which we are not the operator, we monitor the progress of these projects
and the mitigation of risk. In the Terre de Grace project where we are the
operator, we are responsible for managing these potential impacts and the
mitigation of risk.
More information on BP’s investments in Canada’s oil sands can be found
at bp.com/oilsands.
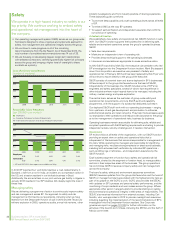
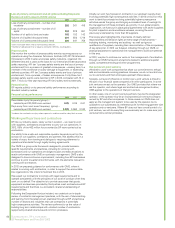
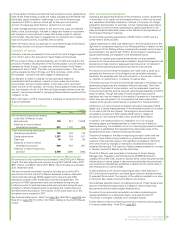
Environmental expenditure
$ million
2012 2011 2010
Environmental expenditure relating
to the Gulf of Mexico oil spill
Spill response 118 671 13,628
Additions to environmental
remediation provision 801 1,167 929
Other environmental expenditure
Operating expenditure 742 704 716
Capital expenditure 1,207 819 911
Clean-ups 46 53 55
Additions to environmental
remediation provision 549 510 361
Additions to decommissioning
provision 3,756 4,596 1,800
Environmental expenditure relating to the Gulf of Mexico oil spill
BP continues to incur significant costs related to the 2010 Gulf of Mexico
oil spill. The spill response cost incurred during 2012 is $118 million (2011
$671 million), and $345 million (2011 $336 million) remains as a provision
at 31 December 2012.
The environmental remediation provision includes amounts for BP’s
commitment to fund the Gulf of Mexico Research Initiative, estimated
natural resource damage (NRD) assessment costs and early NRD
restoration projects under the $1-billion framework agreement. The
provision for NRD assessment costs was increased during the year.
Further amounts for spill response costs were provided during the year,
primarily to reflect increased costs for patrolling and maintenance and
shoreline treatment projects. The majority of the active clean-up of the
shorelines was completed in 2011.
See Financial statements – Note 2 on page 194, Note 36 on page 235 and
Note 43 on page 253 for further information relating to the Gulf of Mexico
oil spill.
Other environmental expenditure
Operating and capital expenditure on the prevention, control, abatement
or elimination of air, water and solid waste pollution is often not incurred
as a separately identifiable transaction. Instead, it forms part of a larger
transaction that includes, for example, normal maintenance expenditure.
The figures for environmental operating and capital expenditure in the
table are therefore estimates, based on the definitions and guidelines of
the American Petroleum Institute.
Environmental operating expenditure of $742 million in 2012 was at a
similar level to 2010 and 2011.
Capital expenditure in 2012 was higher than in 2011 principally due to the
high level of construction activity at our Whiting refinery in relation to new
units as part of the Whiting refinery modernization project which is due to
be completed in the second half of 2013. Similar levels of operating and
capital expenditures are expected in the foreseeable future.
In addition to operating and capital expenditures, we also establish
provisions for future environmental remediation. Expenditure against such
provisions normally occurs in subsequent periods and is not included in
environmental operating expenditure reported for such periods.
Provisions for environmental remediation are made when a clean-up is
probable and the amount of the obligation can be reliably estimated.
Generally, this coincides with the commitment to a formal plan of action
or, if earlier, on divestment or on closure of inactive sites.
The extent and cost of future environmental restoration, remediation and
abatement programmes are inherently difficult to estimate. They often
depend on the extent of contamination, and the associated impact and
timing of the corrective actions required, technological feasibility and BP’s
share of liability. Though the costs of future programmes could be
significant and may be material to the results of operations in the period in
which they are recognized, it is not expected that such costs will be
material to the group’s overall results of operations or financial position.
Additions to our environmental remediation provision increased in 2012
largely due to scope reassessments of the remediation plans of a number
of our sites in the US and Canada. The charge for environmental
remediation provisions in 2012 included $19 million in respect of
provisions for new sites (2011 $12 million and 2010 $54 million).
In addition, we make provisions on installation of our oil- and gas-
producing assets and related pipelines to meet the cost of eventual
decommissioning. On installation of an oil or natural gas production facility
a provision is established that represents the discounted value of the
expected future cost of decommissioning the asset.
The level of increase in the decommissioning provision varies with the
number of new fields coming onstream in a particular year and the
outcome of the periodic reviews. The significant increases in 2010 and
2011 were driven by changes in estimation and detailed reviews of
expected future costs. The majority of these increases related to our sites
in Trinidad, the Gulf of Mexico and the North Sea.
The Gulf of Mexico was impacted by the Bureau of Ocean Energy
Management, Regulation and Enforcement’s (BOEMRE) Notice to
Lessees (NTL) 2010-G05, issued in October 2010, which requires that idle
infrastructure on active leases is decommissioned earlier than previously
was required and establishes guidelines to determine the future utility of
idle infrastructure on active leases.
In 2012 additions to the decommissioning provision were less than in
2011, although still significant, and were again driven by detailed reviews
of expected future costs. The majority of the additions related to our sites
in the North Sea, Alaska, the Gulf of Mexico and Angola.
We undertake periodic reviews of existing provisions. These reviews take
account of revised cost assumptions, changes in decommissioning
requirements and any technological developments.
Provisions for environmental remediation and decommissioning are
usually established on a discounted basis, as required by IAS 37
‘Provisions, Contingent Liabilities and Contingent Assets’.
Further details of decommissioning and environmental provisions appear
in Financial statements – Note 36 on page 235.