BP 2012 Annual Report Download - page 78
Download and view the complete annual report
Please find page 78 of the 2012 BP annual report below. You can navigate through the pages in the report by either clicking on the pages listed below, or by using the keyword search tool below to find specific information within the annual report.-
 1
1 -
2
-
3
-
4
-
5
-
6
-
7
-
8
-
9
-
10
-
11
-
12
-
13
-
14
-
15
-
16
-
17
-
18
-
19
-
20
-
21
-
22
-
23
-
24
-
25
-
26
-
27
-
28
-
29
-
30
-
31
-
32
-
33
-
34
-
35
-
36
-
37
-
38
-
39
-
40
-
41
-
42
-
43
-
44
-
45
-
46
-
47
-
48
-
49
-
50
-
51
-
52
-
53
-
54
-
55
-
56
-
57
-
58
-
59
-
60
-
61
-
62
-
63
-
64
-
65
-
66
-
67
-
 68
68 -
 69
69 -
 70
70 -
 71
71 -
 72
72 -
 73
73 -
 74
74 -
 75
75 -
 76
76 -
 77
77 -
 78
78 -
 79
79 -
 80
80 -
 81
81 -
 82
82 -
 83
83 -
 84
84 -
 85
85 -
 86
86 -
 87
87 -
 88
88 -
89
-
90
-
91
-
92
-
93
-
94
-
95
-
96
-
97
-
98
-
99
-
100
-
101
-
102
-
103
-
104
-
105
-
106
-
107
-
108
-
109
-
110
-
111
-
112
-
113
-
114
-
115
-
116
-
117
-
118
-
119
-
120
-
121
-
122
-
123
-
124
-
125
-
126
-
127
-
128
-
129
-
130
-
131
-
132
-
133
-
134
-
135
-
136
-
137
-
138
-
139
-
140
-
141
-
142
-
143
-
144
-
145
-
146
-
147
-
148
-
149
-
150
-
151
-
152
-
153
-
154
-
155
-
156
-
157
-
158
-
159
-
160
-
161
-
162
-
163
-
164
-
165
-
166
-
167
-
168
-
169
-
170
-
171
-
172
-
173
-
174
-
175
-
176
-
177
-
178
-
179
-
180
-
181
-
182
-
183
-
184
-
185
-
186
-
187
-
188
-
189
-
190
-
191
-
192
-
193
-
194
-
195
-
196
-
197
-
198
-
199
-
200
-
201
-
202
-
203
-
204
-
205
-
206
-
207
-
208
-
209
-
210
-
211
-
212
-
213
-
214
-
215
-
216
-
217
-
218
-
219
-
220
-
221
-
222
-
223
-
224
-
225
-
226
-
227
-
228
-
229
-
230
-
231
-
232
-
233
-
234
-
235
-
236
-
237
-
238
-
239
-
240
-
241
-
242
-
243
-
244
-
245
-
246
-
247
-
248
-
249
-
250
-
251
-
252
-
253
-
254
-
255
-
256
-
257
-
258
-
259
-
260
-
261
-
262
-
263
-
264
-
265
-
266
-
267
-
268
-
269
-
270
-
271
-
272
-
273
-
274
-
275
-
276
-
277
-
278
-
279
-
280
-
281
-
282
-
283
-
284
-
285
-
286
-
287
-
288
-
289
-
290
-
291
-
292
-
293
-
294
-
295
-
296
-
297
-
298
-
299
-
300
-
301
-
302
-
303
 |
 |

Business review: BP in more depth
BP Annual Report and Form 20-F 2012
76
distribution through pipeline and terminal infrastructure; and marketing
and sales to our customers on a regional basis. This integration, together
with a focus on excellent execution and cost management as well as a
strong brand, market presence and customer base, are key to our financial
performance.
The FVC strategy focuses on large-scale, feedstock-advantaged, highly
upgraded, dual-fuel-capable, well-located refineries integrated into
advantaged logistics and marketing. Consequently, in the US, we are in
the process of completing refinery sales that will roughly halve our US
refining capacity through the sale of our Texas City refinery (which
completed on 1 February 2013) and our Carson refinery and related
marketing and logistics assets (see refinery table below). The Texas City
refinerya was not strongly integrated into BP’s marketing assets and has
limited access to logistics and tankage flexibility. The Carson refinery is
gasoline biased and would need investment in logistics and/or
configuration to upgrade capability. This portfolio re-shaping will shift the
balance of our US refining portfolio to northern tier refineries able to
access advantaged, US mid-continent and Canadian crudes and utilize a
significantly greater proportion of heavy crudes.
In our remaining FVCs, we believe we have a portfolio of well-located
refineries, integrated with strong marketing positions offering the potential
for improvement and growth.
a We will retain the petrochemicals manufacturing plants at Texas City.
Refining
At 31 December 2012, we owned or had a share in 16 refineries
producing refined petroleum products that we supply to retail and
commercial customers. On 1 February 2013 we completed the sale of the
Texas City refinery and a portion of our retail and logistics network in the
south-east US to Marathon Petroleum Corporation for up to $2.4 billion. In
addition, we have announced the sale of our South West FVC including
the Carson refinery in California, ARCO network and related logistics
assets in the region to Tesoro Corporation for $2.5 billion and we expect
to close this sale by the middle of 2013 subject to regulatory and other
approvals.
Strategic investments in our refineries are focused on securing the safety
and reliability of our assets while improving the relative unit margins to
capture capability versus the competition. The most important of these
strategic investments under way is the Whiting refinery modernization
project (WRMP), which we expect will allow the capture of additional
margin through the processing of a greater proportion of heavy crudes.
This project made significant progress in 2012 as we entered the
heaviest field construction phase. The new crude oil unit, coker,
upgraded sulphur recovery complex and gasoil hydrotreater all
advanced towards their targeted start-up dates in 2013. The largest of
the refinery’s crude units, which processed sweet crude, was taken
out of service in early November. This outage will allow construction of
a replacement crude distillation unit, and will facilitate demolition of the
existing unit, thereby enabling the expected start-up of the WRMP
project in the second half of 2013. BP is temporarily redeploying
refining and technical resources from around the world to assist with
the start-up of the new units.
We continue to invest in developing capability to produce cleaner fuels
to meet the requirements of our customers and their communities. For
example, we are currently investing in a new hydrotreater unit and
hydrogen plant at our Cherry Point refinery. This project is designed to
allow the refinery to produce fuels that meet ultra-low sulphur diesel
(ULSD) standards for rail and marine diesel customers. In addition, the
new hydrogen plant is designed to improve operation of naphtha
reforming units at the refinery. The project has progressed steadily
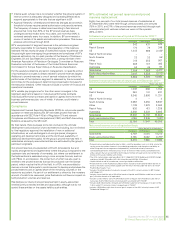
The following tables summarize the BP group’s interests in refineries and average daily crude distillation capacities as at 31 December 2012.
thousand barrels per day
Crude distillation capacitiesa
Group interestbBP
Refinery Fuels value chain %Total share
US
California CarsoncUS South West 100.0 266 266
Washington Cherry Point US North West 100.0 234 234
Indiana Whiting US East of Rockies 100.0 413 413
Ohio Toledo US East of Rockies 50.0 160 80
Texas Texas Cityc– 100.0 475 475
Total US 1,548 1,468
Europe
Germany BayernoildRhine 22.5 217 49
Gelsenkirchen Rhine 50.0 265 132
Karlsruhed Rhine 12.0 322 39
Lingen Rhine 100.0 95 95
Schwedtd Rhine 18.8 239 45
Netherlands Rotterdam Rhine 100.0 377 377
Spain Castellón Iberia 100.0 110 110
Total Europe 1,625 847
Rest of World
Australia Bulwer Australia New Zealand 100.0 102 102
Kwinana Australia New Zealand 100.0 146 146
New Zealand Whangareid Australia New Zealand 23.7 118 28
South Africa Durband Southern Africa 50.0 180 90
Total Rest of World 546 366
Total 3,719 2,681
Capacity relating to assets held for sale (741)
Total capacity post-divestment 1,940
a Crude distillation capacity is gross rated capacity, which is defined as the highest average sustained unit rate for a consecutive 30-day period.
b BP share of equity, which is not necessarily the same as BP share of processing entitlements.
c Refinery classified as assets held for sale at 31 December 2012.
d Indicates refineries not operated by BP.