BP 2012 Annual Report Download - page 284
Download and view the complete annual report
Please find page 284 of the 2012 BP annual report below. You can navigate through the pages in the report by either clicking on the pages listed below, or by using the keyword search tool below to find specific information within the annual report.-
 1
1 -
2
-
3
-
4
-
5
-
6
-
7
-
8
-
9
-
10
-
11
-
12
-
13
-
14
-
15
-
16
-
17
-
18
-
19
-
20
-
21
-
22
-
23
-
24
-
25
-
26
-
27
-
28
-
29
-
30
-
31
-
32
-
33
-
34
-
35
-
36
-
37
-
38
-
39
-
40
-
41
-
42
-
43
-
44
-
45
-
46
-
47
-
48
-
49
-
50
-
51
-
52
-
53
-
54
-
55
-
56
-
57
-
58
-
59
-
60
-
61
-
62
-
63
-
64
-
65
-
66
-
67
-
68
-
69
-
70
-
71
-
72
-
73
-
74
-
75
-
76
-
77
-
78
-
79
-
80
-
81
-
82
-
83
-
84
-
85
-
86
-
87
-
88
-
89
-
90
-
91
-
92
-
93
-
94
-
95
-
96
-
97
-
98
-
99
-
100
-
101
-
102
-
103
-
104
-
105
-
106
-
107
-
108
-
109
-
110
-
111
-
112
-
113
-
114
-
115
-
116
-
117
-
118
-
119
-
120
-
121
-
122
-
123
-
124
-
125
-
126
-
127
-
128
-
129
-
130
-
131
-
132
-
133
-
134
-
135
-
136
-
137
-
138
-
139
-
140
-
141
-
142
-
143
-
144
-
145
-
146
-
147
-
148
-
149
-
150
-
151
-
152
-
153
-
154
-
155
-
156
-
157
-
158
-
159
-
160
-
161
-
162
-
163
-
164
-
165
-
166
-
167
-
168
-
169
-
170
-
171
-
172
-
173
-
174
-
175
-
176
-
177
-
178
-
179
-
180
-
181
-
182
-
183
-
184
-
185
-
186
-
187
-
188
-
189
-
190
-
191
-
192
-
193
-
194
-
195
-
196
-
197
-
198
-
199
-
200
-
201
-
202
-
203
-
204
-
205
-
206
-
207
-
208
-
209
-
210
-
211
-
212
-
213
-
214
-
215
-
216
-
217
-
218
-
219
-
220
-
221
-
222
-
223
-
224
-
225
-
226
-
227
-
228
-
229
-
230
-
231
-
232
-
233
-
234
-
235
-
236
-
237
-
238
-
239
-
240
-
241
-
242
-
243
-
244
-
245
-
246
-
247
-
248
-
249
-
250
-
251
-
252
-
253
-
254
-
255
-
256
-
257
-
258
-
259
-
260
-
261
-
262
-
263
-
264
-
265
-
266
-
267
-
268
-
269
-
270
-
271
-
272
-
273
-
 274
274 -
 275
275 -
 276
276 -
 277
277 -
 278
278 -
 279
279 -
 280
280 -
 281
281 -
 282
282 -
 283
283 -
 284
284 -
 285
285 -
 286
286 -
 287
287 -
 288
288 -
 289
289 -
 290
290 -
 291
291 -
 292
292 -
 293
293 -
 294
294 -
295
-
296
-
297
-
298
-
299
-
300
-
301
-
302
-
303
 |
 |

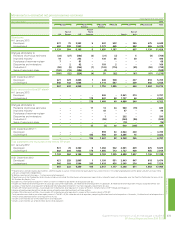
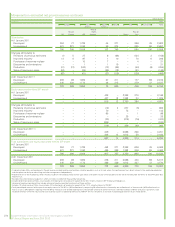
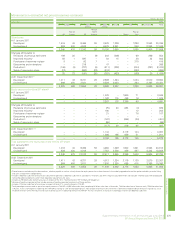
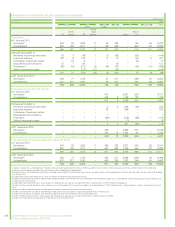
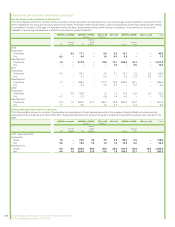
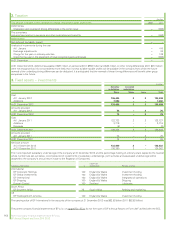
Standardized measure of discounted future net cash flows and changes therein relating to proved oil and gas reserves
The following tables set out the standardized measure of discounted future net cash flows, and changes therein, relating to crude oil and natural gas
production from the group’s estimated proved reserves. This information is prepared in compliance with FASB Oil and Gas Disclosures requirements.
Future net cash flows have been prepared on the basis of certain assumptions which may or may not be realized. These include the timing of future
production, the estimation of crude oil and natural gas reserves and the application of average crude oil and natural gas prices and exchange rates
from the previous 12 months. Furthermore, both proved reserves estimates and production forecasts are subject to revision as further technical
information becomes available and economic conditions change. BP cautions against relying on the information presented because of the highly
arbitrary nature of the assumptions on which it is based and its lack of comparability with the historical cost information presented in the financial
statements.
$ million
2012
Europe North
America
South
America
Africa Asia Australasia Total
UK
Rest of
Europe US
Rest of
North
America Russia
Rest of
Asia
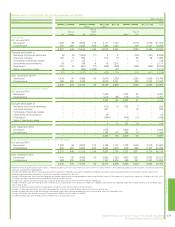
At 31 December 2012
Subsidiaries
Future cash inflowsa88,000 30,800 261,100 – 30,400 75,800 – 54,200 54,300 594,600
Future production costb24,600 10,400 117,000 – 10,700 17,200 – 14,000 19,000 212,900
Future development costb7,400 2,400 29,600 – 7,700 13,000 – 10,900 3,700 74,700
Future taxationc35,200 11,700 40,700 – 6,300 17,500 – 6,900 8,400 126,700
Future net cash flows 20,800 6,300 73,800 – 5,700 28,100 – 22,400 23,200 180,300
10% annual discountd10,900 2,400 40,100 – 2,700 10,900 – 8,300 11,800 87,100
Standardized measure of discounted future net
cash flowse9,900 3,900 33,700 – 3,000 17,200 – 14,100 11,400 93,200
Equity-accounted entities (BP share)f
Future cash inflowsa– – – 9,500 49,400 – 203,600 24,400 – 286,900
Future production costb– – – 4,600 24,800 – 133,400 21,000 – 183,800
Future development costb– – – 2,400 5,500 – 16,600 1,900 – 26,400
Future taxationc– – – 400 6,600 – 10,100 200 – 17,300
Future net cash flows – – – 2,100 12,500 – 43,500 1,300 – 59,400
10% annual discountd– – – 2,000 7,600 – 21,600 300 – 31,500
Standardized measure of discounted future net
cash flows
gh
– – – 100 4,900 – 21,900 1,000 – 27,900
Total subsidiaries and equity-accounted entities
Standardized measure of discounted future net
cash flowsi9,900 3,900 33,700 100 7,900 17,200 21,900 15,100 11,400 121,100
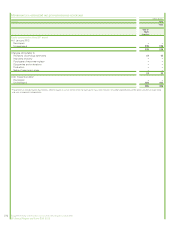
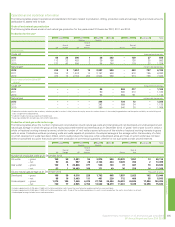
The following are the principal sources of change in the standardized measure of discounted future net cash flows:
$ million
Subsidiaries
Equity-accounted
entities (BP share)
Total subsidiaries and
equity-accounted
entities
Sales and transfers of oil and gas produced, net of production costs (34,600) (8,300) (42,900)
Development costs for the current year as estimated in previous year 13,800 3,700 17,500
Extensions, discoveries and improved recovery, less related costs 8,000 1,200 9,200
Net changes in prices and production cost (14,600) 2,200 (12,400)
Revisions of previous reserves estimates (16,200) (800) (17,000)
Net change in taxation 23,000 500 23,500
Future development costs (7,100) (1,100) (8,200)
Net change in purchase and sales of reserves-in-place (6,800) (100) (6,900)
Addition of 10% annual discount 11,600 2,800 14,400
Total change in the standardized measure during the yearj(22,900) 100 (22,800)
aThe marker prices used were Brent $111.13/bbl, Henry Hub $2.75/mmBtu.
bProduction costs, which include production taxes, and development costs relating to future production of proved reserves are based on the continuation of existing economic conditions. Future
decommissioning costs are included.
cTaxation is computed using appropriate year-end statutory corporate income tax rates.
dFuture net cash flows from oil and natural gas production are discounted at 10% regardless of the group assessment of the risk associated with its producing activities.
eMinority interest in BP Trinidad and Tobago LLC amounted to $900 million.
fThe standardized measure of discounted future net cash flows of equity-accounted entities includes standardized measure of discounted future net cash flows of equity-accounted investments of those
entities.
gMinority interest in TNK-BP amounted to $1,600 million in Russia.
hNo equity-accounted future cash flows in Africa because proved reserves are received as a result of contractual arrangements, with no associated costs.
iIncludes future net cash flows for assets held for sale at 31 December 2012.
jTotal change in the standardized measure during the year includes the effect of exchange rate movements.
282 Supplementary information on oil and natural gas (unaudited)
BP Annual Report and Form 20-F 2012