BP 2012 Annual Report Download - page 248
Download and view the complete annual report
Please find page 248 of the 2012 BP annual report below. You can navigate through the pages in the report by either clicking on the pages listed below, or by using the keyword search tool below to find specific information within the annual report.-
 1
1 -
2
-
3
-
4
-
5
-
6
-
7
-
8
-
9
-
10
-
11
-
12
-
13
-
14
-
15
-
16
-
17
-
18
-
19
-
20
-
21
-
22
-
23
-
24
-
25
-
26
-
27
-
28
-
29
-
30
-
31
-
32
-
33
-
34
-
35
-
36
-
37
-
38
-
39
-
40
-
41
-
42
-
43
-
44
-
45
-
46
-
47
-
48
-
49
-
50
-
51
-
52
-
53
-
54
-
55
-
56
-
57
-
58
-
59
-
60
-
61
-
62
-
63
-
64
-
65
-
66
-
67
-
68
-
69
-
70
-
71
-
72
-
73
-
74
-
75
-
76
-
77
-
78
-
79
-
80
-
81
-
82
-
83
-
84
-
85
-
86
-
87
-
88
-
89
-
90
-
91
-
92
-
93
-
94
-
95
-
96
-
97
-
98
-
99
-
100
-
101
-
102
-
103
-
104
-
105
-
106
-
107
-
108
-
109
-
110
-
111
-
112
-
113
-
114
-
115
-
116
-
117
-
118
-
119
-
120
-
121
-
122
-
123
-
124
-
125
-
126
-
127
-
128
-
129
-
130
-
131
-
132
-
133
-
134
-
135
-
136
-
137
-
138
-
139
-
140
-
141
-
142
-
143
-
144
-
145
-
146
-
147
-
148
-
149
-
150
-
151
-
152
-
153
-
154
-
155
-
156
-
157
-
158
-
159
-
160
-
161
-
162
-
163
-
164
-
165
-
166
-
167
-
168
-
169
-
170
-
171
-
172
-
173
-
174
-
175
-
176
-
177
-
178
-
179
-
180
-
181
-
182
-
183
-
184
-
185
-
186
-
187
-
188
-
189
-
190
-
191
-
192
-
193
-
194
-
195
-
196
-
197
-
198
-
199
-
200
-
201
-
202
-
203
-
204
-
205
-
206
-
207
-
208
-
209
-
210
-
211
-
212
-
213
-
214
-
215
-
216
-
217
-
218
-
219
-
220
-
221
-
222
-
223
-
224
-
225
-
226
-
227
-
228
-
229
-
230
-
231
-
232
-
233
-
234
-
235
-
236
-
237
-
 238
238 -
 239
239 -
 240
240 -
 241
241 -
 242
242 -
 243
243 -
 244
244 -
 245
245 -
 246
246 -
 247
247 -
 248
248 -
 249
249 -
 250
250 -
 251
251 -
 252
252 -
 253
253 -
 254
254 -
 255
255 -
 256
256 -
 257
257 -
 258
258 -
259
-
260
-
261
-
262
-
263
-
264
-
265
-
266
-
267
-
268
-
269
-
270
-
271
-
272
-
273
-
274
-
275
-
276
-
277
-
278
-
279
-
280
-
281
-
282
-
283
-
284
-
285
-
286
-
287
-
288
-
289
-
290
-
291
-
292
-
293
-
294
-
295
-
296
-
297
-
298
-
299
-
300
-
301
-
302
-
303
 |
 |

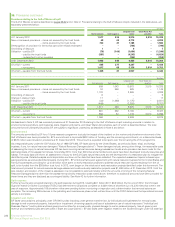
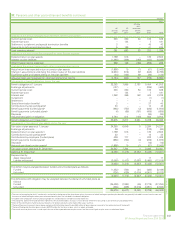
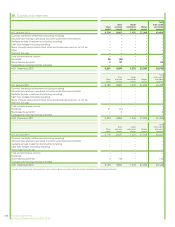
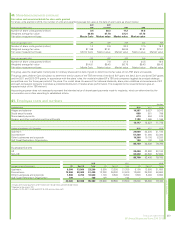
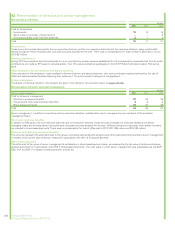
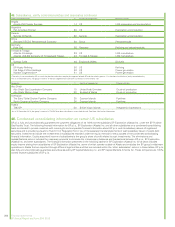
39. Capital and reserves
Share
capital
Share
premium
account
Capital
redemption
reserve
Merger
reserve
Total
share capital
and capital
reserves
At 1 January 2012 5,224 9,952 1,072 27,206 43,454
Currency translation differences (including recycling) –– –– –
Actuarial loss relating to pensions and other post-retirement benefits –– –– –
Available-for-sale investments (including recycling) –– –– –
Cash flow hedges (including recycling) –– –– –
Share of equity-accounted entities’ other comprehensive income, net of tax –– –– –
Other –– –– –
Profit for the year –– –– –
Total comprehensive income –– –– –
Dividends 35 (35) – – –
Share-based paymentsa257 – – 59
Transactions involving minority interests –– –– –
At 31 December 2012 5,261 9,974 1,072 27,206 43,513
Share
capital
Share
premium
account
Capital
redemption
reserve
Merger
reserve
Total
share capital
and capital
reserves
At 1 January 2011 5,183 9,987 1,072 27,206 43,448
Currency translation differences (including recycling) – – – – –
Actuarial loss relating to pensions and other post-retirement benefits – – – – –
Available-for-sale investments (including recycling) – – – – –
Cash flow hedges (including recycling) – – – – –
Share of equity-accounted entities’ other comprehensive income, net of tax – – – – –
Profit for the year –– –– –
Total comprehensive income – – – – –
Dividends 41 (41) – – –
Share-based paymentsa–6 –– 6
Transactions involving minority interests – – – – –
At 31 December 2011 5,224 9,952 1,072 27,206 43,454
Share
capital
Share
premium
account
Capital
redemption
reserve
Merger
reserve
Total
share capital
and capital
reserves
At 1 January 2010 5,179 9,847 1,072 27,206 43,304
Currency translation differences (including recycling) – – – – –
Actuarial loss relating to pensions and other post-retirement benefits – – – – –
Available-for-sale investments (including recycling) – – – – –
Cash flow hedges (including recycling) – – – – –
Profit (loss) for the year –– –– –
Total comprehensive income – – – – –
Dividends –– –– –
Share-based paymentsa4 140 – – 144
Transactions involving minority interests – – – – –
At 31 December 2010 5,183 9,987 1,072 27,206 43,448
aIncludes new share issues and movements in own shares and treasury shares where these relate to employee share-based payment plans.
246 Financial statements
BP Annual Report and Form 20-F 2012