BP 2012 Annual Report Download - page 262
Download and view the complete annual report
Please find page 262 of the 2012 BP annual report below. You can navigate through the pages in the report by either clicking on the pages listed below, or by using the keyword search tool below to find specific information within the annual report.-
 1
1 -
2
-
3
-
4
-
5
-
6
-
7
-
8
-
9
-
10
-
11
-
12
-
13
-
14
-
15
-
16
-
17
-
18
-
19
-
20
-
21
-
22
-
23
-
24
-
25
-
26
-
27
-
28
-
29
-
30
-
31
-
32
-
33
-
34
-
35
-
36
-
37
-
38
-
39
-
40
-
41
-
42
-
43
-
44
-
45
-
46
-
47
-
48
-
49
-
50
-
51
-
52
-
53
-
54
-
55
-
56
-
57
-
58
-
59
-
60
-
61
-
62
-
63
-
64
-
65
-
66
-
67
-
68
-
69
-
70
-
71
-
72
-
73
-
74
-
75
-
76
-
77
-
78
-
79
-
80
-
81
-
82
-
83
-
84
-
85
-
86
-
87
-
88
-
89
-
90
-
91
-
92
-
93
-
94
-
95
-
96
-
97
-
98
-
99
-
100
-
101
-
102
-
103
-
104
-
105
-
106
-
107
-
108
-
109
-
110
-
111
-
112
-
113
-
114
-
115
-
116
-
117
-
118
-
119
-
120
-
121
-
122
-
123
-
124
-
125
-
126
-
127
-
128
-
129
-
130
-
131
-
132
-
133
-
134
-
135
-
136
-
137
-
138
-
139
-
140
-
141
-
142
-
143
-
144
-
145
-
146
-
147
-
148
-
149
-
150
-
151
-
152
-
153
-
154
-
155
-
156
-
157
-
158
-
159
-
160
-
161
-
162
-
163
-
164
-
165
-
166
-
167
-
168
-
169
-
170
-
171
-
172
-
173
-
174
-
175
-
176
-
177
-
178
-
179
-
180
-
181
-
182
-
183
-
184
-
185
-
186
-
187
-
188
-
189
-
190
-
191
-
192
-
193
-
194
-
195
-
196
-
197
-
198
-
199
-
200
-
201
-
202
-
203
-
204
-
205
-
206
-
207
-
208
-
209
-
210
-
211
-
212
-
213
-
214
-
215
-
216
-
217
-
218
-
219
-
220
-
221
-
222
-
223
-
224
-
225
-
226
-
227
-
228
-
229
-
230
-
231
-
232
-
233
-
234
-
235
-
236
-
237
-
238
-
239
-
240
-
241
-
242
-
243
-
244
-
245
-
246
-
247
-
248
-
249
-
250
-
251
-
 252
252 -
 253
253 -
 254
254 -
 255
255 -
 256
256 -
 257
257 -
 258
258 -
 259
259 -
 260
260 -
 261
261 -
 262
262 -
 263
263 -
 264
264 -
 265
265 -
 266
266 -
 267
267 -
 268
268 -
 269
269 -
 270
270 -
 271
271 -
 272
272 -
273
-
274
-
275
-
276
-
277
-
278
-
279
-
280
-
281
-
282
-
283
-
284
-
285
-
286
-
287
-
288
-
289
-
290
-
291
-
292
-
293
-
294
-
295
-
296
-
297
-
298
-
299
-
300
-
301
-
302
-
303
 |
 |

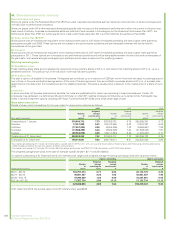
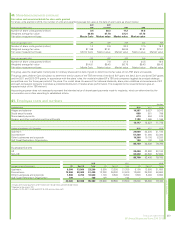
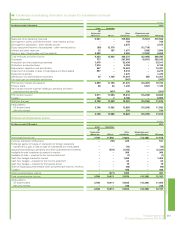
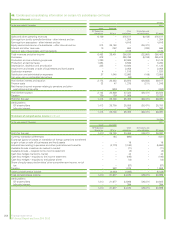
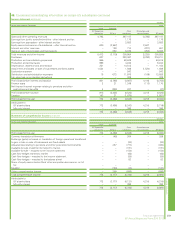
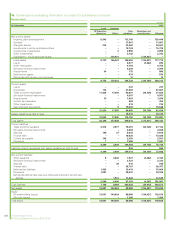
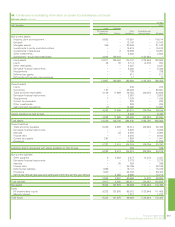
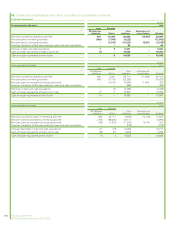
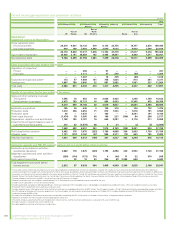
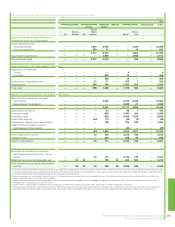
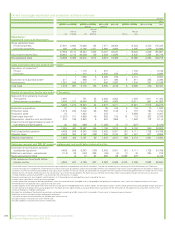
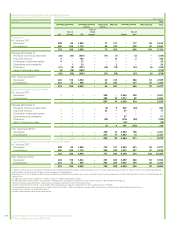
46. Condensed consolidating information on certain US subsidiaries continued
Balance sheet
$ million
At 31 December 2012
Issuer Guarantor
BP Exploration
(Alaska) Inc. BP p.l.c.
Other
subsidiaries
Eliminations and
reclassifications BP group
Non-current assets
Property, plant and equipment 8,343 – 112,105 – 120,448
Goodwill – – 11,861 – 11,861
Intangible assets 379 – 23,662 – 24,041
Investments in jointly controlled entities – – 15,724 – 15,724
Investments in associates – 2 2,996 – 2,998
Other investments – – 2,702 – 2,702
Subsidiaries – equity-accounted basis – 136,421 – (136,421) –
Fixed assets 8,722 136,423 169,050 (136,421) 177,774
Loans – – 4,977 (4,282) 695
Other receivables – – 4,754 – 4,754
Derivative financial instruments – – 4,294 – 4,294
Prepayments 34 – 775 – 809
Deferred tax assets – – 874 – 874
Defined benefit pension plan surpluses – – 12 – 12
8,756 136,423 184,736 (140,703) 189,212
Current assets
Loans – – 247 – 247
Inventories 174 – 27,693 – 27,867
Trade and other receivables 11,835 17,496 43,061 (34,728) 37,664
Derivative financial instruments – – 4,507 – 4,507
Prepayments 15 – 1,043 – 1,058
Current tax receivable – – 456 – 456
Other investments – – 319 – 319
Cash and cash equivalents – 9 19,539 – 19,548
12,024 17,505 96,865 (34,728) 91,666
Assets classified as held for sale – – 19,315 – 19,315
12,024 17,505 116,180 (34,728) 110,981
Total assets 20,780 153,928 300,916 (175,431) 300,193
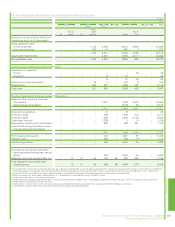
Current liabilities
Trade and other payables 3,914 2,577 75,391 (34,728) 47,154
Derivative financial instruments – – 2,658 – 2,658
Accruals 140 27 6,643 – 6,810
Finance debt – – 10,030 – 10,030
Current tax payable 145 – 2,356 – 2,501
Provisions 1 – 7,586 – 7,587
4,200 2,604 104,664 (34,728) 76,740
Liabilities directly associated with assets classified as held for sale – – 846 – 846
4,200 2,604 105,510 (34,728) 77,586
Non-current liabilities
Other payables 8 4,449 1,927 (4,282) 2,102
Derivative financial instruments – – 2,723 – 2,723
Accruals – 38 410 – 448
Finance debt – – 38,767 – 38,767
Deferred tax liabilities 1,654 – 13,410 – 15,064
Provisions 1,887 – 28,447 – 30,334
Defined benefit pension plan and other post-retirement benefit plan
deficits – 1,913 11,636 – 13,549
3,549 6,400 97,320 (4,282) 102,987
Total liabilities 7,749 9,004 202,830 (39,010) 180,573
Net assets 13,031 144,924 98,086 (136,421) 119,620
Equity
BP shareholders’ equity 13,031 144,924 96,880 (136,421) 118,414
Minority interest – – 1,206 – 1,206
Total equity 13,031 144,924 98,086 (136,421) 119,620
260 Financial statements
BP Annual Report and Form 20-F 2012