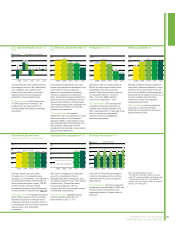
BP 2012 Annual Report Download - page 29
Download and view the complete annual report
Please find page 29 of the 2012 BP annual report below. You can navigate through the pages in the report by either clicking on the pages listed below, or by using the keyword search tool below to find specific information within the annual report.-
 1
1 -
2
-
3
-
4
-
5
-
6
-
7
-
8
-
9
-
10
-
11
-
12
-
13
-
14
-
15
-
16
-
17
-
18
-
 19
19 -
 20
20 -
 21
21 -
 22
22 -
 23
23 -
 24
24 -
 25
25 -
 26
26 -
 27
27 -
 28
28 -
 29
29 -
 30
30 -
 31
31 -
 32
32 -
 33
33 -
 34
34 -
 35
35 -
 36
36 -
 37
37 -
 38
38 -
 39
39 -
40
-
41
-
42
-
43
-
44
-
45
-
46
-
47
-
48
-
49
-
50
-
51
-
52
-
53
-
54
-
55
-
56
-
57
-
58
-
59
-
60
-
61
-
62
-
63
-
64
-
65
-
66
-
67
-
68
-
69
-
70
-
71
-
72
-
73
-
74
-
75
-
76
-
77
-
78
-
79
-
80
-
81
-
82
-
83
-
84
-
85
-
86
-
87
-
88
-
89
-
90
-
91
-
92
-
93
-
94
-
95
-
96
-
97
-
98
-
99
-
100
-
101
-
102
-
103
-
104
-
105
-
106
-
107
-
108
-
109
-
110
-
111
-
112
-
113
-
114
-
115
-
116
-
117
-
118
-
119
-
120
-
121
-
122
-
123
-
124
-
125
-
126
-
127
-
128
-
129
-
130
-
131
-
132
-
133
-
134
-
135
-
136
-
137
-
138
-
139
-
140
-
141
-
142
-
143
-
144
-
145
-
146
-
147
-
148
-
149
-
150
-
151
-
152
-
153
-
154
-
155
-
156
-
157
-
158
-
159
-
160
-
161
-
162
-
163
-
164
-
165
-
166
-
167
-
168
-
169
-
170
-
171
-
172
-
173
-
174
-
175
-
176
-
177
-
178
-
179
-
180
-
181
-
182
-
183
-
184
-
185
-
186
-
187
-
188
-
189
-
190
-
191
-
192
-
193
-
194
-
195
-
196
-
197
-
198
-
199
-
200
-
201
-
202
-
203
-
204
-
205
-
206
-
207
-
208
-
209
-
210
-
211
-
212
-
213
-
214
-
215
-
216
-
217
-
218
-
219
-
220
-
221
-
222
-
223
-
224
-
225
-
226
-
227
-
228
-
229
-
230
-
231
-
232
-
233
-
234
-
235
-
236
-
237
-
238
-
239
-
240
-
241
-
242
-
243
-
244
-
245
-
246
-
247
-
248
-
249
-
250
-
251
-
252
-
253
-
254
-
255
-
256
-
257
-
258
-
259
-
260
-
261
-
262
-
263
-
264
-
265
-
266
-
267
-
268
-
269
-
270
-
271
-
272
-
273
-
274
-
275
-
276
-
277
-
278
-
279
-
280
-
281
-
282
-
283
-
284
-
285
-
286
-
287
-
288
-
289
-
290
-
291
-
292
-
293
-
294
-
295
-
296
-
297
-
298
-
299
-
300
-
301
-
302
-
303
 |
 |

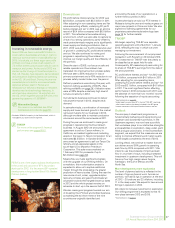
Investing in renewable energy
Since 2005 we have invested $7.6 billion in
lower-carbon businesses and are on track to
meet our commitment to invest $8 billion by
2015. In biofuels, our three sugar cane mills
in Brazil now have a total crush capacity of
7.2 million tonnes and produce fuels for use in
transport and power. At the end of 2012 we
started up the Vivergo JV bioethanol plant in
Hull, UK. We also have research, demonstration
and production facilities planned or operating
in the US, UK and Brazil. During the year we
cancelled plans to build a commercial-scale
cellulosic ethanol plant in Florida and
refocused our cellulosic strategy on research,
development and technology licensing. In
wind we have interests in 16 wind farms in
the US, which together provide BP with a net
generating capacity of 1,558MW.a
Alternative Energy
For more on our activities see Other
businesses and corporate page 82.
Downstream
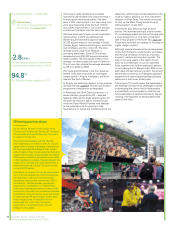
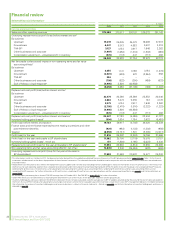
RC profit before interest and tax for 2012 was
$2.8 billion, compared with $5.5 billion in 2011.
After adjusting for non-operating items and fair
value accounting effects, underlying RC profit
before interest and taxb in 2012 was an all-time
record of $6.4 billion compared with $6.0 billion
in 2011. This reflected a favourable refining
environment, which we were able to capture by
virtue of our strong operations, partly offset by
weak petrochemicals margins and a significantly
lower supply and trading contribution than in
2011. 2012 was also our fourth consecutive year
of growth in underlying RC profit before interest
and tax. We also continued to make good
progress in repositioning Downstream to
improve our margin quality and the efficiency of
the portfolio.
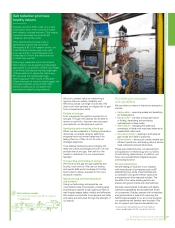
Since the start of 2008, our focus on safe and
reliable operations in Downstream has
translated into improvements in process safety.
We have seen a 55% reduction in loss of
primary containment and a 40% reduction in our
process safety incident index over the period.
Refinery operations were strong this year, with
Solomon refining availability of 94.8%. (See
refining availability on page 74.) Utilization rates
were at 88% despite a relatively high level of
turnaround activity in 2012.
Our lubricants business continued to deliver
robust performance in 2012, despite weak
demand.
In petrochemicals, a combination of increased
supply and lower demand growth in the market
narrowed margins for our business in 2012,
although we were able to maintain production
volumes at around the same levels as 2011.
During the year we continued to make good
progress in repositioning the Downstream
business. In August 2012 we announced an
agreement to sell our Carson refinery, in
California, and related logistics and marketing
assets in the region to Tesoro Corporation for an
estimated $2.5 billion. In October 2012 we
announced an agreement to sell our Texas City
refinery and all associated assets in the
south-east US to Marathon Petroleum
Corporation. This sale was completed on
1 February 2013 for proceeds of up to
$2.4 billion (see page 72).
Meanwhile, we made significant progress
with the upgrade of our Whiting refinery. On
completion, this modernization project is
expected to allow us to capture additional
margin through the processing of a greater
proportion of heavy crudes. During the year the
new crude oil unit, coker, upgraded sulphur
recovery complex and gasoil hydrotreater all
advanced towards their targeted start-up dates
in 2013 and the whole project remains on
schedule to start up in the second half of 2013.
We also made good progress towards our aim
of divesting the LPG bulk and bottled business,
completing the exit from three of the nine
countries we originally identified and
announcing the sale of our operations in a
further three countries in 2012.
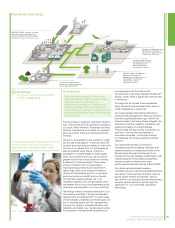
In petrochemicals we sold our PTA interest in
Malaysia during the year and made progress on
major new projects in China and India. We also
signed two licensing agreements for our
proprietary petrochemicals technology (see
page 16 for further details).
TNK-BP
We began reporting TNK-BP as a separate
operating segment with effect from 1 January
2012, reflecting the way in which we were
managing our investment.
Following the announcement of our proposed
transaction with Rosneft on 22 October 2012,
BP’s investment in TNK-BP met the criteria to
be classified as an asset held for sale.
Consequently, BP ceased equity accounting for
its share of TNK-BP’s earnings from the date of
the announcement.
RC profit before interest and taxbc for 2012 was
$3.4 billion, compared with $4.1 billion in 2011.
After adjusting for non-operating items,
underlying RC profit before interest and taxbc for
2012 was $3.1 billion, compared with $4.1 billion
in 2011. The most significant factor affecting
performance in 2012 compared with 2011 was
the absence of more than two months’ income
following the cessation of equity accounting.
b See footnote b on page 34.
c
Under equity accounting, BP’s share of TNK-BP’s earnings
after interest and tax has been included in the BP group
income statement within profit before interest and tax.
Outlook
The company’s divestment programme is
fundamentally reshaping and repositioning our
upstream and downstream portfolios. In the
Upstream segment, we now have a portfolio
that we believe plays to our distinctive strengths
and capabilities in exploration, deep water, giant
fields and gas value chains. In the Downstream
segment, we expect that the measures we are
taking to improve efficiency and margin quality
will be largely complete by the end of 2013.
Looking ahead, we continue to expect that we
can deliver around 50% growth in operating
cash flow by 2014 compared with 2011.d We
intend to use the proceeds of improved cash
flow in a number of ways, including increased
investment in upstream development. This will
focus on four high-margin areas: Angola,
Azerbaijan, the Gulf of Mexico and the
North Sea.
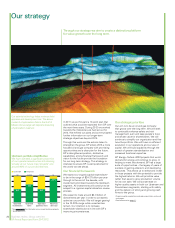
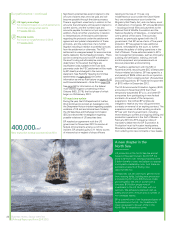
More development, more exploration
The level of planned activity is reflected in the
number of rigs we have at work. Across our
portfolio, we had 53 rigs in operation at the end
of 2012 – 20 onshore and 33 offshore, including
11 in the deep water. We expect to have around
60 rigs in operation in 2014.
We intend to increase investment in exploration.
Our drilling programme is expected to test 15
new plays between 2012 and 2015.
d See footnote c on page 21.
a
Excludes 32MW of capacity in the Netherlands, which is
managed by our Downstream segment.
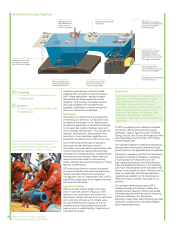
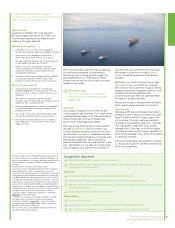
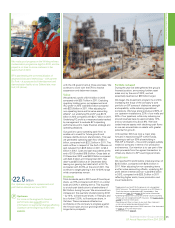
PSVM is one of the largest subsea developments
in the world and was one of BP’s key project
start-ups for 2012. It is the second BP-operated
development in Angola after Block 18’s Greater
Plutonio (below).
TNK-BP
For more on the segment’s financial
performance see pages 80-81.
Business review: Group overview
BP Annual Report and Form 20-F 2012 27
Business review: Group overview