BP 2012 Annual Report Download - page 215
Download and view the complete annual report
Please find page 215 of the 2012 BP annual report below. You can navigate through the pages in the report by either clicking on the pages listed below, or by using the keyword search tool below to find specific information within the annual report.-
 1
1 -
2
-
3
-
4
-
5
-
6
-
7
-
8
-
9
-
10
-
11
-
12
-
13
-
14
-
15
-
16
-
17
-
18
-
19
-
20
-
21
-
22
-
23
-
24
-
25
-
26
-
27
-
28
-
29
-
30
-
31
-
32
-
33
-
34
-
35
-
36
-
37
-
38
-
39
-
40
-
41
-
42
-
43
-
44
-
45
-
46
-
47
-
48
-
49
-
50
-
51
-
52
-
53
-
54
-
55
-
56
-
57
-
58
-
59
-
60
-
61
-
62
-
63
-
64
-
65
-
66
-
67
-
68
-
69
-
70
-
71
-
72
-
73
-
74
-
75
-
76
-
77
-
78
-
79
-
80
-
81
-
82
-
83
-
84
-
85
-
86
-
87
-
88
-
89
-
90
-
91
-
92
-
93
-
94
-
95
-
96
-
97
-
98
-
99
-
100
-
101
-
102
-
103
-
104
-
105
-
106
-
107
-
108
-
109
-
110
-
111
-
112
-
113
-
114
-
115
-
116
-
117
-
118
-
119
-
120
-
121
-
122
-
123
-
124
-
125
-
126
-
127
-
128
-
129
-
130
-
131
-
132
-
133
-
134
-
135
-
136
-
137
-
138
-
139
-
140
-
141
-
142
-
143
-
144
-
145
-
146
-
147
-
148
-
149
-
150
-
151
-
152
-
153
-
154
-
155
-
156
-
157
-
158
-
159
-
160
-
161
-
162
-
163
-
164
-
165
-
166
-
167
-
168
-
169
-
170
-
171
-
172
-
173
-
174
-
175
-
176
-
177
-
178
-
179
-
180
-
181
-
182
-
183
-
184
-
185
-
186
-
187
-
188
-
189
-
190
-
191
-
192
-
193
-
194
-
195
-
196
-
197
-
198
-
199
-
200
-
201
-
202
-
203
-
204
-
 205
205 -
 206
206 -
 207
207 -
 208
208 -
 209
209 -
 210
210 -
 211
211 -
 212
212 -
 213
213 -
 214
214 -
 215
215 -
 216
216 -
 217
217 -
 218
218 -
 219
219 -
 220
220 -
 221
221 -
 222
222 -
 223
223 -
 224
224 -
 225
225 -
226
-
227
-
228
-
229
-
230
-
231
-
232
-
233
-
234
-
235
-
236
-
237
-
238
-
239
-
240
-
241
-
242
-
243
-
244
-
245
-
246
-
247
-
248
-
249
-
250
-
251
-
252
-
253
-
254
-
255
-
256
-
257
-
258
-
259
-
260
-
261
-
262
-
263
-
264
-
265
-
266
-
267
-
268
-
269
-
270
-
271
-
272
-
273
-
274
-
275
-
276
-
277
-
278
-
279
-
280
-
281
-
282
-
283
-
284
-
285
-
286
-
287
-
288
-
289
-
290
-
291
-
292
-
293
-
294
-
295
-
296
-
297
-
298
-
299
-
300
-
301
-
302
-
303
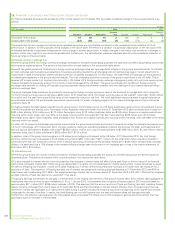
 |
 |

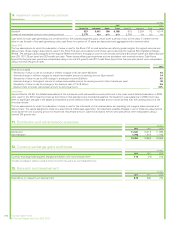
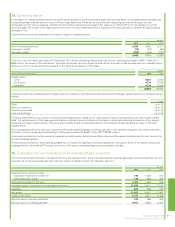
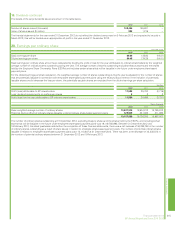
Tax included directly in equity
$ million
2012 2011 2010
Current tax (10) – (37)
Deferred tax 4(7) 64
(6) (7) 27
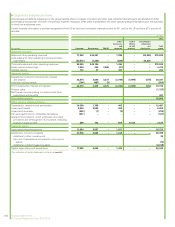
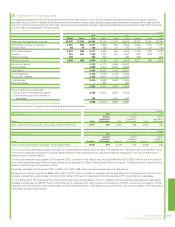
Reconciliation of the effective tax rate
The following table provides a reconciliation of the UK statutory corporation tax rate to the effective tax rate of the group on profit or loss before
taxation. With effect from 1 April 2012 the UK statutory corporation tax rate reduced from 26% to 24% on profits arising from activities outside the
North Sea.
For 2010, the items presented in the reconciliation are distorted as a result of the overall tax credit for the year and the loss before taxation. In orderto
provide a more meaningful analysis of the effective tax rate for 2010, the table also presents separate reconciliations for the group excluding the
impacts of the Gulf of Mexico oil spill, and for the impacts of the Gulf of Mexico oil spill in isolation.
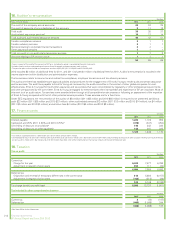
$ million
2012 2011
2010
excluding
impacts of Gulf
of Mexico oil
spill
2010
impacts of
Gulf of
Mexico oil spill 2010
Profit (loss) before taxation 18,809 38,834 36,110 (40,935) (4,825)
Tax charge (credit) on profit (loss) 6,993 12,737 11,393 (12,894) (1,501)
Effective tax rate 37% 33% 32% 31% 31%
% of profit or loss before taxation
UK statutory corporation tax rate 24 26 28 28 28
Increase (decrease) resulting from
UK supplementary and overseas taxes at higher or lower ratesa11 14 9 7 (4)
Tax reported in equity-accounted entities (5) (3) (3) – 23
Adjustments in respect of prior years 1(1) – – 2
Movements in losses not recognized ––––1
Tax incentives for investment (2) (1) (1) – 9
Gulf of Mexico oil spill non-deductible costs 8– – (4) (30)
Permanent differences relating to disposals –(2) (1) – 5
Other –– – – (3)
Effective tax rate 37 33 32 31 31
aFor 2012, the jurisdictions which contributed significantly to this item were Angola, with an applicable statutory tax rate of 50%, the UK, with an applicable statutory tax rate of 62% for North Sea
activities, and Trinidad & Tobago, with an applicable statutory tax rate of 55%.
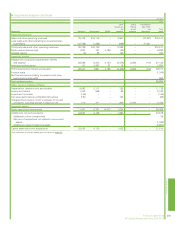
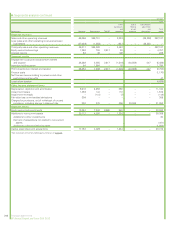
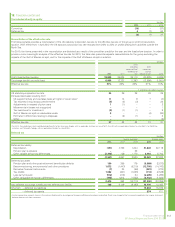
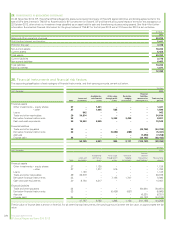
Deferred tax
$ million
Income statement Balance sheet
2012 2011a2010a2012 2011a
Deferred tax liability
Depreciation (121) 4,738 1,304 31,839 32,119
Pension plan surpluses ––38 ––
Other taxable temporary differences (2,240) 149 1,178 3,681 5,704
(2,361) 4,887 2,520 35,520 37,823
Deferred tax asset
Pension plan and other post-retirement benefit plan deficits 160 388 179 (3,389) (2,872)
Decommissioning, environmental and other provisions 1,872 (1,443) (8,210) (12,705) (14,743)
Derivative financial instruments (7) 24 (56) (281) (274)
Tax credits 1,802 (401) (1,088) (714) (2,549)
Loss carry forward (912) (218) 24 (2,209) (1,295)
Other deductible temporary differences (445) 1,912 (1,562) (2,032) (1,623)
2,470 262 (10,713) (21,330) (23,356)
Net deferred tax charge (credit) and net deferred tax liability 109 5,149 (8,193) 14,190 14,467
Of which – deferred tax liabilities 15,064 15,078
– deferred tax assets 874 611
aCertain comparative amounts shown in the analysis of deferred tax by category of temporary difference have been reclassified. There is no change to the tax amounts reported in the income statement,
balance sheet or cash flow statement.
Financial statements 213
BP Annual Report and Form 20-F 2012
Financial statements
18. Taxation continued