BP 2012 Annual Report Download - page 8
Download and view the complete annual report
Please find page 8 of the 2012 BP annual report below. You can navigate through the pages in the report by either clicking on the pages listed below, or by using the keyword search tool below to find specific information within the annual report.-
 1
1 -
 2
2 -
 3
3 -
 4
4 -
 5
5 -
 6
6 -
 7
7 -
 8
8 -
 9
9 -
 10
10 -
 11
11 -
 12
12 -
 13
13 -
 14
14 -
 15
15 -
 16
16 -
 17
17 -
 18
18 -
 19
19 -
20
-
21
-
22
-
23
-
24
-
25
-
26
-
27
-
28
-
29
-
30
-
31
-
32
-
33
-
34
-
35
-
36
-
37
-
38
-
39
-
40
-
41
-
42
-
43
-
44
-
45
-
46
-
47
-
48
-
49
-
50
-
51
-
52
-
53
-
54
-
55
-
56
-
57
-
58
-
59
-
60
-
61
-
62
-
63
-
64
-
65
-
66
-
67
-
68
-
69
-
70
-
71
-
72
-
73
-
74
-
75
-
76
-
77
-
78
-
79
-
80
-
81
-
82
-
83
-
84
-
85
-
86
-
87
-
88
-
89
-
90
-
91
-
92
-
93
-
94
-
95
-
96
-
97
-
98
-
99
-
100
-
101
-
102
-
103
-
104
-
105
-
106
-
107
-
108
-
109
-
110
-
111
-
112
-
113
-
114
-
115
-
116
-
117
-
118
-
119
-
120
-
121
-
122
-
123
-
124
-
125
-
126
-
127
-
128
-
129
-
130
-
131
-
132
-
133
-
134
-
135
-
136
-
137
-
138
-
139
-
140
-
141
-
142
-
143
-
144
-
145
-
146
-
147
-
148
-
149
-
150
-
151
-
152
-
153
-
154
-
155
-
156
-
157
-
158
-
159
-
160
-
161
-
162
-
163
-
164
-
165
-
166
-
167
-
168
-
169
-
170
-
171
-
172
-
173
-
174
-
175
-
176
-
177
-
178
-
179
-
180
-
181
-
182
-
183
-
184
-
185
-
186
-
187
-
188
-
189
-
190
-
191
-
192
-
193
-
194
-
195
-
196
-
197
-
198
-
199
-
200
-
201
-
202
-
203
-
204
-
205
-
206
-
207
-
208
-
209
-
210
-
211
-
212
-
213
-
214
-
215
-
216
-
217
-
218
-
219
-
220
-
221
-
222
-
223
-
224
-
225
-
226
-
227
-
228
-
229
-
230
-
231
-
232
-
233
-
234
-
235
-
236
-
237
-
238
-
239
-
240
-
241
-
242
-
243
-
244
-
245
-
246
-
247
-
248
-
249
-
250
-
251
-
252
-
253
-
254
-
255
-
256
-
257
-
258
-
259
-
260
-
261
-
262
-
263
-
264
-
265
-
266
-
267
-
268
-
269
-
270
-
271
-
272
-
273
-
274
-
275
-
276
-
277
-
278
-
279
-
280
-
281
-
282
-
283
-
284
-
285
-
286
-
287
-
288
-
289
-
290
-
291
-
292
-
293
-
294
-
295
-
296
-
297
-
298
-
299
-
300
-
301
-
302
-
303
 |
 |

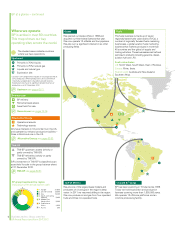
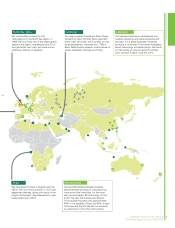
The shaded areas indicate countries
where we have operations.
BP at a glance – continued
TNK-BP see pages 80-81.
Upstream see pages 63-71.
1
6
2
3
4
5
7
1. Europe 31,600
2. US and Canada 23,800
3. Asia 16,400
4. South and Central
5. Middle East,
North Africa 5,500
6. Sub-Saharan
Africa 2,300
7. Russia 300
America 5,800
BP group headcount by region
(including 14,700 service station staff)
Alaska
We opened our Alaska office in 1959 and
acquired our first federal licences that year.
We now operate 13 oilfields and four pipelines.
We also own a significant interest in six other
producing fields.
Gulf of Mexico
We are one of the largest lease holders and
producers of oil and gas in the region’s deep
water. In 2011 we resumed drilling in the region.
We now produce oil and gas from four operated
hubs and three non-operated hubs.
Downstream see pages 72-79.
Alternative Energy see pages 82-83.
Downstream
BP refinery.
Petrochemicals site(s).
Asset held for sale.
Where we operate
BP is active in over 80 countries.
This map shows our key
operating sites across the world.
Upstreama
Primarily (>75%) liquids.
Primarily (>75%) natural gas.
Liquids and natural gas.
Exploration site.
TNK-BP
TNK-BP upstream assets (wholly or
partly owned by TNK-BP).
TNK-BP refineries (wholly or partly
owned by TNK-BP).
BP’s investment in TNK-BP is classified as an
asset held for sale in the group balance sheet
at 31 December 2012.
Alternative Energy
Operational assets.
Technology assets.
We have interests in 16 wind farms in the US,
and operate four ethanol production facilities –
three in Brazil and one in the UK.
Fuels
The fuels business is made up of seven
regionally based fuels value chains (FVCs), a
number of regionally focused fuels marketing
businesses, a global aviation fuels marketing
business that markets products in more than
45 countries and the global oil supply and
trading activities. These businesses sell refined
petroleum products including gasoline, diesel,
aviation fuel and LPG.
Fuels value chains
US: North West, South West, East of Rockies.
Europe: Rhine, Iberia.
Rest of world: Australia and New Zealand,
Southern Africa.
a Locations are categorized as liquids or natural gas based on
2012 production. Where production is yet to commence
materially, categorization is based on proved reserves.
Exploration sites have no significant proved reserves or
production as at 31 December 2012.
Trinidad & Tobago
BP has been exploring in Trinidad since 1939.
Today we hold exploration and production
licences covering more than 1,800,000 acres.
We operate 13 offshore platforms and an
onshore processing facility.
Business review: Group overview
BP Annual Report and Form 20-F 2012
6