BP 2012 Annual Report Download - page 200
Download and view the complete annual report
Please find page 200 of the 2012 BP annual report below. You can navigate through the pages in the report by either clicking on the pages listed below, or by using the keyword search tool below to find specific information within the annual report.-
 1
1 -
2
-
3
-
4
-
5
-
6
-
7
-
8
-
9
-
10
-
11
-
12
-
13
-
14
-
15
-
16
-
17
-
18
-
19
-
20
-
21
-
22
-
23
-
24
-
25
-
26
-
27
-
28
-
29
-
30
-
31
-
32
-
33
-
34
-
35
-
36
-
37
-
38
-
39
-
40
-
41
-
42
-
43
-
44
-
45
-
46
-
47
-
48
-
49
-
50
-
51
-
52
-
53
-
54
-
55
-
56
-
57
-
58
-
59
-
60
-
61
-
62
-
63
-
64
-
65
-
66
-
67
-
68
-
69
-
70
-
71
-
72
-
73
-
74
-
75
-
76
-
77
-
78
-
79
-
80
-
81
-
82
-
83
-
84
-
85
-
86
-
87
-
88
-
89
-
90
-
91
-
92
-
93
-
94
-
95
-
96
-
97
-
98
-
99
-
100
-
101
-
102
-
103
-
104
-
105
-
106
-
107
-
108
-
109
-
110
-
111
-
112
-
113
-
114
-
115
-
116
-
117
-
118
-
119
-
120
-
121
-
122
-
123
-
124
-
125
-
126
-
127
-
128
-
129
-
130
-
131
-
132
-
133
-
134
-
135
-
136
-
137
-
138
-
139
-
140
-
141
-
142
-
143
-
144
-
145
-
146
-
147
-
148
-
149
-
150
-
151
-
152
-
153
-
154
-
155
-
156
-
157
-
158
-
159
-
160
-
161
-
162
-
163
-
164
-
165
-
166
-
167
-
168
-
169
-
170
-
171
-
172
-
173
-
174
-
175
-
176
-
177
-
178
-
179
-
180
-
181
-
182
-
183
-
184
-
185
-
186
-
187
-
188
-
189
-
 190
190 -
 191
191 -
 192
192 -
 193
193 -
 194
194 -
 195
195 -
 196
196 -
 197
197 -
 198
198 -
 199
199 -
 200
200 -
 201
201 -
 202
202 -
 203
203 -
 204
204 -
 205
205 -
 206
206 -
 207
207 -
 208
208 -
 209
209 -
 210
210 -
211
-
212
-
213
-
214
-
215
-
216
-
217
-
218
-
219
-
220
-
221
-
222
-
223
-
224
-
225
-
226
-
227
-
228
-
229
-
230
-
231
-
232
-
233
-
234
-
235
-
236
-
237
-
238
-
239
-
240
-
241
-
242
-
243
-
244
-
245
-
246
-
247
-
248
-
249
-
250
-
251
-
252
-
253
-
254
-
255
-
256
-
257
-
258
-
259
-
260
-
261
-
262
-
263
-
264
-
265
-
266
-
267
-
268
-
269
-
270
-
271
-
272
-
273
-
274
-
275
-
276
-
277
-
278
-
279
-
280
-
281
-
282
-
283
-
284
-
285
-
286
-
287
-
288
-
289
-
290
-
291
-
292
-
293
-
294
-
295
-
296
-
297
-
298
-
299
-
300
-
301
-
302
-
303
 |
 |

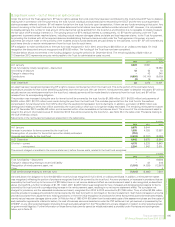
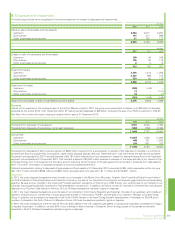
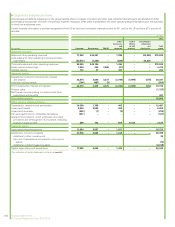
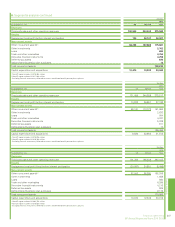
2. Significant event – Gulf of Mexico oil spill continued
The total amount in the income statement is analysed in the table below. Costs charged directly to the income statement in 2010 in relation to spill
response, environmental and litigation and claims are those that arose prior to recording a provision at the end of the second quarter of that year.
$ million
2012 2011 2010
Trust fund liability – discounted –– 19,580
Change in discounting relating to trust fund liability –43 240
Recognition of reimbursement asset, net (1,191) (4,038) (12,567)
Other ––8
Total (credit) charge relating to the trust fund (1,191) (3,995) 7,261
Spill response – amount provided 109 586 10,883
Spill response – costs charged directly to the income statement 985 2,745
Total charge relating to spill response 118 671 13,628
Environmental – amount provided 801 1,167 929
Environmental – change in discount rate relating to provisions –17 5
Environmental – costs charged directly to the income statement ––70
Total charge relating to environmental 801 1,184 1,004
Litigation and claims – amount provided, net of derecognition of provision 5,164 3,430 14,939
Litigation and claims – costs charged directly to the income statement –– 184
Total charge relating to litigation and claims 5,164 3,430 15,123
Clean Water Act penalties – amount provided –– 3,510
Other costs charged directly to the income statement 248 427 332
Settlements credited to the income statement (145) (5,517) –
(Profit) loss before interest and taxation 4,995 (3,800) 40,858
Finance costs 19 58 77
(Profit) loss before taxation 5,014 (3,742) 40,935
The total amounts that will ultimately be paid by BP in relation to all obligations relating to the incident are subject to significant uncertainty as described
above under Provisions and contingencies.
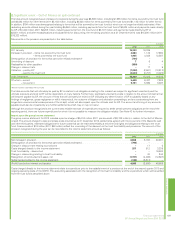
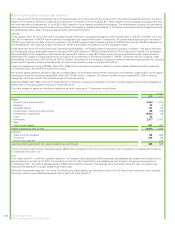
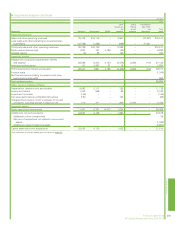
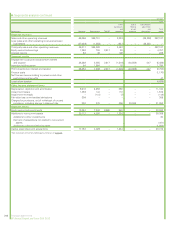
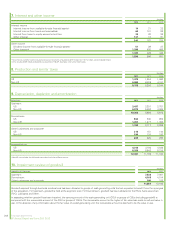
3. Business combinations
Business combinations in 2012
BP undertook a number of minor business combinations in 2012 for a total consideration of $116 million in cash. The most significant of these was the
acquisition of Shell and Cosan Indústria e Commércio’s interests in significant aviation fuels assets at seven Brazilian airports in the Downstream
segment. Fair value adjustments were made to the acquired assets and liabilities.
Certain measurement period adjustments were recognized in 2012 relating to the Reliance transaction, a business combination undertaken in 2011 –
see below for further details.
Business combinations in 2011
BP undertook a number of business combinations in 2011. Total consideration paid in cash amounted to $11.3 billion, offset by cash acquired of
$0.4 billion. The fair value of contingent consideration payable amounted to $0.1 billion.
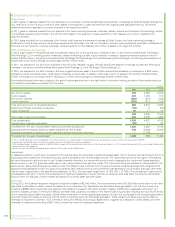
On 30 August 2011, BP acquired from Reliance Industries Limited (Reliance) a 30% interest in 21 oil and gas production-sharing agreements (PSAs)
operated by Reliance in India for $7,026 million. This included the producing KG D6 block. In addition, on 17 November 2011, the companies formed a
50:50 joint venture for the sourcing and marketing of gas in India. This transaction provided BP with access to an emerging market with growth in
energy demand; it builds BP’s business in natural gas and it represents an important partnership with a leading national energy business.
The transaction was accounted for as a business combination using the acquisition method. During 2012, measurement period adjustments amounted
to an overall decrease of $115 million in the net fair value of the identifiable assets and liabilities acquired, an increase of $46 million in the goodwill
arising on acquisition and an adjustment to reduce the contingent consideration to nil.
Goodwill of $2,569 million arose on acquisition, attributed to market access and other benefits arising from the business combination.
198 Financial statements
BP Annual Report and Form 20-F 2012