BP 2012 Annual Report Download - page 242
Download and view the complete annual report
Please find page 242 of the 2012 BP annual report below. You can navigate through the pages in the report by either clicking on the pages listed below, or by using the keyword search tool below to find specific information within the annual report.-
 1
1 -
2
-
3
-
4
-
5
-
6
-
7
-
8
-
9
-
10
-
11
-
12
-
13
-
14
-
15
-
16
-
17
-
18
-
19
-
20
-
21
-
22
-
23
-
24
-
25
-
26
-
27
-
28
-
29
-
30
-
31
-
32
-
33
-
34
-
35
-
36
-
37
-
38
-
39
-
40
-
41
-
42
-
43
-
44
-
45
-
46
-
47
-
48
-
49
-
50
-
51
-
52
-
53
-
54
-
55
-
56
-
57
-
58
-
59
-
60
-
61
-
62
-
63
-
64
-
65
-
66
-
67
-
68
-
69
-
70
-
71
-
72
-
73
-
74
-
75
-
76
-
77
-
78
-
79
-
80
-
81
-
82
-
83
-
84
-
85
-
86
-
87
-
88
-
89
-
90
-
91
-
92
-
93
-
94
-
95
-
96
-
97
-
98
-
99
-
100
-
101
-
102
-
103
-
104
-
105
-
106
-
107
-
108
-
109
-
110
-
111
-
112
-
113
-
114
-
115
-
116
-
117
-
118
-
119
-
120
-
121
-
122
-
123
-
124
-
125
-
126
-
127
-
128
-
129
-
130
-
131
-
132
-
133
-
134
-
135
-
136
-
137
-
138
-
139
-
140
-
141
-
142
-
143
-
144
-
145
-
146
-
147
-
148
-
149
-
150
-
151
-
152
-
153
-
154
-
155
-
156
-
157
-
158
-
159
-
160
-
161
-
162
-
163
-
164
-
165
-
166
-
167
-
168
-
169
-
170
-
171
-
172
-
173
-
174
-
175
-
176
-
177
-
178
-
179
-
180
-
181
-
182
-
183
-
184
-
185
-
186
-
187
-
188
-
189
-
190
-
191
-
192
-
193
-
194
-
195
-
196
-
197
-
198
-
199
-
200
-
201
-
202
-
203
-
204
-
205
-
206
-
207
-
208
-
209
-
210
-
211
-
212
-
213
-
214
-
215
-
216
-
217
-
218
-
219
-
220
-
221
-
222
-
223
-
224
-
225
-
226
-
227
-
228
-
229
-
230
-
231
-
 232
232 -
 233
233 -
 234
234 -
 235
235 -
 236
236 -
 237
237 -
 238
238 -
 239
239 -
 240
240 -
 241
241 -
 242
242 -
 243
243 -
 244
244 -
 245
245 -
 246
246 -
 247
247 -
 248
248 -
 249
249 -
 250
250 -
 251
251 -
 252
252 -
253
-
254
-
255
-
256
-
257
-
258
-
259
-
260
-
261
-
262
-
263
-
264
-
265
-
266
-
267
-
268
-
269
-
270
-
271
-
272
-
273
-
274
-
275
-
276
-
277
-
278
-
279
-
280
-
281
-
282
-
283
-
284
-
285
-
286
-
287
-
288
-
289
-
290
-
291
-
292
-
293
-
294
-
295
-
296
-
297
-
298
-
299
-
300
-
301
-
302
-
303
 |
 |

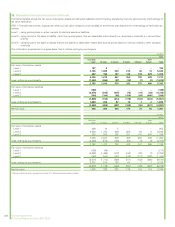
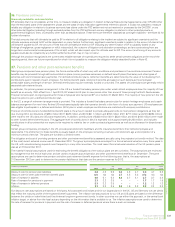
37. Pensions and other post-retirement benefits continued
Our assumptions for the rate of increase in salaries are based on our inflation assumption plus an allowance for expected long-term real salary growth.
These include allowance for promotion-related salary growth, of between 0.3% and 1.0% depending on country. In addition to the financial
assumptions, we regularly review the demographic and mortality assumptions.
The mortality assumptions reflect best practice in the countries in which we provide pensions, and have been chosen with regard to the latest available
published tables adjusted where appropriate to reflect the experience of the group and an extrapolation of past longevity improvements into the future.
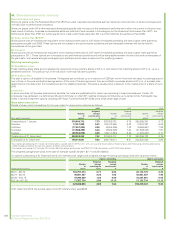
BP’s most substantial pension liabilities are in the UK, the US and Germany where our mortality assumptions are as follows:
Years
Mortality assumptions
2012 2011
UK
2010 2012 2011
US
2010 2012 2011
Germany
2010
Life expectancy at age 60 for a male currently aged 60 27.7 27.6 26.1 24.9 24.8 24.7 23.6 23.5 23.3
Life expectancy at age 60 for a male currently aged 40 30.6 30.5 29.1 26.3 26.3 26.2 26.5 26.3 26.2
Life expectancy at age 60 for a female currently aged 60 29.4 29.3 28.7 26.4 26.4 26.3 28.2 28.0 27.9
Life expectancy at age 60 for a female currently aged 40 32.1 32.0 31.6 27.3 27.3 27.2 30.8 30.7 30.6
Our assumption for future US healthcare cost trend rate for the first year after the reporting date reflects the rate of actual cost increases seen in
recent years. The ultimate trend rate reflects our long-term expectations of the level at which cost inflation will stabilize based on past healthcare cost
inflation seen over a longer period of time. The assumed future US healthcare cost trend rate assumptions are as follows:
%
2012 2011 2010
First year’s US healthcare cost trend rate 7.3 7.6 7.8
Ultimate US healthcare cost trend rate 5.0 5.0 5.0
Year in which ultimate trend rate is reached 2020 2020 2018
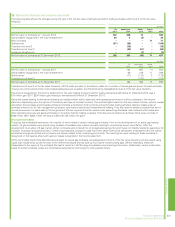
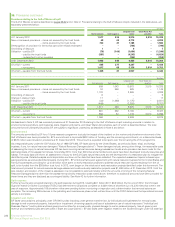
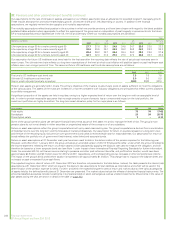
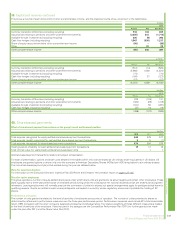
Pension plan assets are generally held in trusts. The primary objective of the trusts is to accumulate pools of assets sufficient to meet the obligations
of the various plans. The assets of the trusts are invested in a manner consistent with fiduciary obligations and principles that reflect current practices
in portfolio management.
A significant proportion of the assets are held in equities, owing to a higher expected level of return over the long term with an acceptable level of
risk. In order to provide reasonable assurance that no single security or type of security has an unwarranted impact on the total portfolio, the
investment portfolios are highly diversified. The long-term asset allocation policy for the major plans is as follows:
%
Asset category UK US Other
Total equity 73 70 17-62
Bonds/cash 20 30 25-75
Property/real estate 7 – 0-10
Some of the group’s pension plans use derivative financial instruments as part of their asset mix and to manage the level of risk. The group’s main
pension plans do not invest directly in either securities or property/real estate of the company or of any subsidiary.
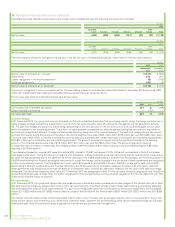
Return on asset assumptions reflect the group’s expectations built up by asset class and by plan. The group’s expectation is derived from a combination
of historical returns over the long term and the forecasts of market professionals. Our assumption for return on equities is based on a long-term view,
and the size of the resulting equity risk premium over government bond yields is reviewed each year for reasonableness. Our assumption for return on
bonds reflects the portfolio mix of government fixed-interest, index-linked and corporate bonds.
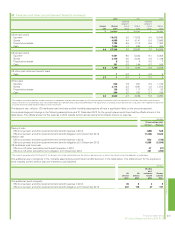
Return on asset assumptions at 31 December each year have been used to date in the determination of the pension expense for the following year.
However, with effect from 1 January 2013, the group will adopt an amended version of IAS 19 ‘Employee Benefits’, under which the amount credited to
the income statement reflecting the return on pension assets will be calculated by applying the discount rate used to measure the obligation, and will
therefore be based on a lower corporate bond rate (see Note 1 under Impact of new International Financial Reporting Standards for further information).
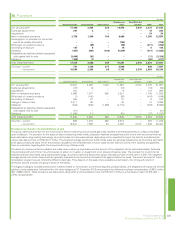
Under the amended IAS 19, net finance income relating to pensions and other post-retirement benefits, and profit before taxation, would have been
approximately $0.8 billion and $0.7 billion lower for 2012 and 2011 respectively, with corresponding pre-tax increases in other comprehensive income.
The impact on the group’s 2013 profit before taxation is expected to be approximately $1.0 billion. This change has no impact on the balance sheet and
no impact on past or expected future cash flows.
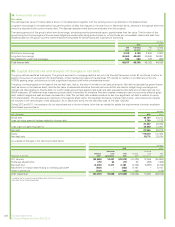
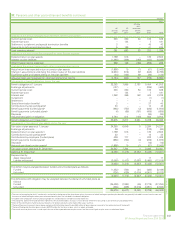
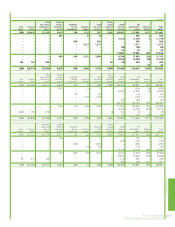
The expected long-term rates of return at 31 December 2012 are therefore not presented in the table below. Instead, the table presents the interest rate
assumptions at 31 December 2012, which are equal to the discount rate assumptions for plan liabilities as noted above and which will be used in the
determination of the pension expense for 2013. For 2011 and 2010, the expected long-term rates of return and market values of the various categories
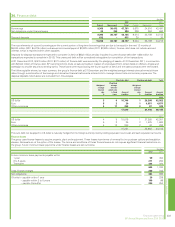
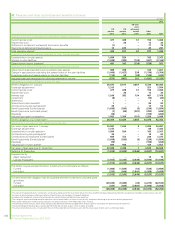
of assets held by the defined benefit plans at 31 December are presented. The market values include the effects of derivative financial instruments. The
amounts classified as equities include investments in companies listed on stock exchanges as well as unlisted investments. Movements in the value of
plan assets during the year are shown in detail in the table on page 242.
240 Financial statements
BP Annual Report and Form 20-F 2012