BP 2012 Annual Report Download - page 54
Download and view the complete annual report
Please find page 54 of the 2012 BP annual report below. You can navigate through the pages in the report by either clicking on the pages listed below, or by using the keyword search tool below to find specific information within the annual report.-
 1
1 -
2
-
3
-
4
-
5
-
6
-
7
-
8
-
9
-
10
-
11
-
12
-
13
-
14
-
15
-
16
-
17
-
18
-
19
-
20
-
21
-
22
-
23
-
24
-
25
-
26
-
27
-
28
-
29
-
30
-
31
-
32
-
33
-
34
-
35
-
36
-
37
-
38
-
39
-
40
-
41
-
42
-
43
-
 44
44 -
 45
45 -
 46
46 -
 47
47 -
 48
48 -
 49
49 -
 50
50 -
 51
51 -
 52
52 -
 53
53 -
 54
54 -
 55
55 -
 56
56 -
 57
57 -
 58
58 -
 59
59 -
 60
60 -
 61
61 -
 62
62 -
 63
63 -
 64
64 -
65
-
66
-
67
-
68
-
69
-
70
-
71
-
72
-
73
-
74
-
75
-
76
-
77
-
78
-
79
-
80
-
81
-
82
-
83
-
84
-
85
-
86
-
87
-
88
-
89
-
90
-
91
-
92
-
93
-
94
-
95
-
96
-
97
-
98
-
99
-
100
-
101
-
102
-
103
-
104
-
105
-
106
-
107
-
108
-
109
-
110
-
111
-
112
-
113
-
114
-
115
-
116
-
117
-
118
-
119
-
120
-
121
-
122
-
123
-
124
-
125
-
126
-
127
-
128
-
129
-
130
-
131
-
132
-
133
-
134
-
135
-
136
-
137
-
138
-
139
-
140
-
141
-
142
-
143
-
144
-
145
-
146
-
147
-
148
-
149
-
150
-
151
-
152
-
153
-
154
-
155
-
156
-
157
-
158
-
159
-
160
-
161
-
162
-
163
-
164
-
165
-
166
-
167
-
168
-
169
-
170
-
171
-
172
-
173
-
174
-
175
-
176
-
177
-
178
-
179
-
180
-
181
-
182
-
183
-
184
-
185
-
186
-
187
-
188
-
189
-
190
-
191
-
192
-
193
-
194
-
195
-
196
-
197
-
198
-
199
-
200
-
201
-
202
-
203
-
204
-
205
-
206
-
207
-
208
-
209
-
210
-
211
-
212
-
213
-
214
-
215
-
216
-
217
-
218
-
219
-
220
-
221
-
222
-
223
-
224
-
225
-
226
-
227
-
228
-
229
-
230
-
231
-
232
-
233
-
234
-
235
-
236
-
237
-
238
-
239
-
240
-
241
-
242
-
243
-
244
-
245
-
246
-
247
-
248
-
249
-
250
-
251
-
252
-
253
-
254
-
255
-
256
-
257
-
258
-
259
-
260
-
261
-
262
-
263
-
264
-
265
-
266
-
267
-
268
-
269
-
270
-
271
-
272
-
273
-
274
-
275
-
276
-
277
-
278
-
279
-
280
-
281
-
282
-
283
-
284
-
285
-
286
-
287
-
288
-
289
-
290
-
291
-
292
-
293
-
294
-
295
-
296
-
297
-
298
-
299
-
300
-
301
-
302
-
303
 |
 |

Business review: BP in more depth
BP Annual Report and Form 20-F 2012
52
The equipment is designed to operate in water depths of up to
10,000 feet. It includes a remotely operated vehicles intervention system,
a subsea dispersant injection system and subsea debris removal
equipment and a deepwater well cap.
See Safety on pages 46-50 for further information on BP’s approach to oil
spill prevention and for performance data on loss of primary containment.
Gulf of Mexico – our long-term commitments
See Gulf of Mexico oil spill on pages 59-62 for further information on BP’s
response to the incident and environmental and economic restoration
efforts.
Climate change
Climate change represents a significant challenge for society and the
energy industry, including BP. In response to the challenges and
opportunities, BP is continuing to take a number of practical steps,
including investing in lower-carbon energy products such as biofuels and
wind, and ventures focused on sustainable energy solutions. We seek to
manage our own GHG emissions through our OMS, by requiring our
operations to incorporate energy use considerations in their business
plans and to assess, prioritize and implement technologies and systems
to improve energy usage.
As part of our OMS and project screening process, we consider and
identify risks and potential impacts of a changing climate on our facilities
and operations.
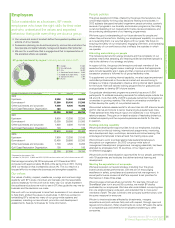
Greenhouse gas emissions
Our direct GHG emissionsa were 59.8 million tonnes (Mte) in 2012,
compared with 61.8Mte in 2011, a decrease of 2.0Mte versus 2011.
The net effect of acquisitions and divestments is a decrease of 0.7Mte,
primarily the result of the sale of upstream assets as part of our
divestment programme. Operational changes led to a decrease of 0.7Mte,
principally due to temporary reductions in activity at some of our upstream
sites and one of our major US refineries and lower mileage by our
shipping vessels. Improvements made by our businesses to calculate
their emissions more accurately resulted in a net decrease of 0.4Mte. We
achieved 0.2Mte of sustainable emissions reductions in 2012.
a We report GHG emissions on a CO2-equivalent basis, including CO2 and methane. This
represents all consolidated entities and BP’s share of equity-accounted entities except TNK-BP.
Over the long term it is likely that the carbon intensity of our upstream
operations will continue to trend upwards as we move further into
technically challenging and potentially more energy-intensive areas. The
carbon intensity will likely remain relatively flat or even decrease in certain
refining operations because of improved energy efficiency even with the
trend towards processing heavier crudes.
Greenhouse gas regulation
In the future, we expect that additional regulation of GHG emissions
aimed at addressing climate change will have an increasing impact on our
businesses, operating costs and strategic planning, but may also offer
opportunities for the development of lower-carbon technologies and
businesses.
To help address potential future regulation, we factor a carbon cost into
our investment appraisals and engineering designs for new projects
where appropriate. We do this in order to assess, and protect the value of,
our new investments under future scenarios in which the cost of carbon
emissions is higher than it is today. We require larger projects, and those
for which emissions costs would be a material part of the project, to apply
a standard carbon cost to the projected GHG emissions over the life of the
project. The standard cost is based on our estimate of the carbon price
that might realistically be expected in particular parts of the world. In
industrialized countries, this standard cost assumption is currently $40 per
tonne of CO2 equivalent. We use this cost as a basis for assessing the
economic value of the investment and as one consideration in optimizing
the way the project is engineered with respect to emissions.
See Regulation of the group’s business – Greenhouse gas regulation on
pages 96-97.
Climate change adaptation
We are taking steps to prepare for the potential physical impacts of
climate change on our existing and future operations. We are working
closely with Imperial College in the UK to develop specialized climate
models that help us better understand and predict possible impacts
resulting from the changing climate.
Projects implementing our environmental and social practices are required
to assess the potential impacts to the project from the changing climate
and manage any identified significant potential impacts. Where climate
change impacts are identified as a risk for a project, our engineers seek to
address them in the project design like any other physical and ecological
hazard. We periodically review and adjust existing design criteria and
engineering technology practices. For example, a regional climate model
was used in 2012 to inform decisions on the depth of cover required for
river crossings for the South Caucasus Pipeline and to review any risks
associated with landslides.
We regularly update and improve our climate impact modelling tools and
make them available to both new projects and existing operations. An
internal guide, available to both existing operations and projects, has been
in place since 2010. It sets out guidance on how to assess potential risks
and impacts from a changing climate to enable mitigation steps to be
incorporated into project planning, design and operations.
Water
BP recognizes the importance of managing water effectively and
efficiently in areas of water stress or scarcity, the need to minimize water
quality impacts from our discharges, and the need to protect water
resources at our operations.
We are continuing to pilot and develop standardized tools to more deeply
understand the nature of the risks and opportunities associated with
water management at a strategic and local level. This includes an
assessment of water scarcity, the impact of changing effluent discharge
standards, and the long-term social and environmental pressures on water
resources within the local area. We also commissioned Harvard University
in the US to conduct research in 2012 on the allocation and use of water in
Jordan, the United Arab Emirates, Iraq and Oman. This will be followed
through in 2013 and 2014 with more detailed research in three or four of
these countries. This will equip BP with peer-reviewed science as a basis
for planning water needs for oil and gas developments in the Middle East.
Unconventional gas and hydraulic fracturing
Natural gas resources, including unconventional gas, have an increasingly
important role in meeting the world’s growing energy needs. New
technologies are making it possible to extract unconventional gas
resources safely, responsibly and economically. BP has unconventional
gas operations in the US, Algeria, Indonesia and Oman.
Hydraulic fracturing is the process of pumping water, mixed with a small
proportion of sand and chemicals, underground at a high enough pressure
to split and keep open the rock and release natural gas that would
otherwise not be accessible. Some stakeholders have expressed
concerns about the potential environmental and community impacts of
this process.
BP recognizes these concerns and seeks to apply responsible well design,
construction and operation to mitigate the risk that natural gas and
hydraulic fracturing fluids enter underground aquifers, including drinking
water sources. We are trialling a number of water-saving innovations to
minimize the amount of fresh water used in our drilling and hydraulic
fracturing operations.
Water and sand constitute on average 99.5% of the injection fluid. This is
mixed with chemicals to create the fracturing fluid that is pumped
underground at high pressure to fracture the rock with the sand propping
the fractures open. The chemicals used in this process help to reduce
friction and control bacterial growth in the well. Some of them are
classified as hazardous materials, as are the constituents of many
everyday products when in concentrated form. Each chemical used in the
fracturing process is listed in the material safety data sheets at each site,
which detail safe dosage limits. We submit data on chemicals used at our
hydraulically fractured wells in the US at fracfocus.org.
At our operating sites, we aim to minimize air pollutant and GHG
emissions by, for example, seeking to use natural gas or electricity instead