BP 2012 Annual Report Download - page 246
Download and view the complete annual report
Please find page 246 of the 2012 BP annual report below. You can navigate through the pages in the report by either clicking on the pages listed below, or by using the keyword search tool below to find specific information within the annual report.-
 1
1 -
 2
2 -
 3
3 -
 4
4 -
 5
5 -
 6
6 -
 7
7 -
 8
8 -
 9
9 -
 10
10 -
 11
11 -
 12
12 -
 13
13 -
 14
14 -
 15
15 -
 16
16 -
 17
17 -
 18
18 -
 19
19 -
 20
20 -
 21
21 -
 22
22 -
 23
23 -
 24
24 -
 25
25 -
 26
26 -
 27
27 -
 28
28 -
 29
29 -
 30
30 -
 31
31 -
 32
32 -
 33
33 -
 34
34 -
 35
35 -
 36
36 -
 37
37 -
 38
38 -
 39
39 -
 40
40 -
 41
41 -
 42
42 -
 43
43 -
 44
44 -
 45
45 -
 46
46 -
 47
47 -
 48
48 -
 49
49 -
 50
50 -
 51
51 -
 52
52 -
 53
53 -
 54
54 -
 55
55 -
 56
56 -
 57
57 -
 58
58 -
 59
59 -
 60
60 -
 61
61 -
 62
62 -
 63
63 -
 64
64 -
 65
65 -
 66
66 -
 67
67 -
 68
68 -
 69
69 -
 70
70 -
 71
71 -
 72
72 -
 73
73 -
 74
74 -
 75
75 -
 76
76 -
 77
77 -
 78
78 -
 79
79 -
 80
80 -
 81
81 -
 82
82 -
 83
83 -
 84
84 -
 85
85 -
 86
86 -
 87
87 -
 88
88 -
 89
89 -
 90
90 -
 91
91 -
 92
92 -
 93
93 -
 94
94 -
 95
95 -
 96
96 -
 97
97 -
 98
98 -
 99
99 -
 100
100 -
 101
101 -
 102
102 -
 103
103 -
 104
104 -
 105
105 -
 106
106 -
 107
107 -
 108
108 -
 109
109 -
 110
110 -
 111
111 -
 112
112 -
 113
113 -
 114
114 -
 115
115 -
 116
116 -
 117
117 -
 118
118 -
 119
119 -
 120
120 -
 121
121 -
 122
122 -
 123
123 -
 124
124 -
 125
125 -
 126
126 -
 127
127 -
 128
128 -
 129
129 -
 130
130 -
 131
131 -
 132
132 -
 133
133 -
 134
134 -
 135
135 -
 136
136 -
 137
137 -
 138
138 -
 139
139 -
 140
140 -
 141
141 -
 142
142 -
 143
143 -
 144
144 -
 145
145 -
 146
146 -
 147
147 -
 148
148 -
 149
149 -
 150
150 -
 151
151 -
 152
152 -
 153
153 -
 154
154 -
 155
155 -
 156
156 -
 157
157 -
 158
158 -
 159
159 -
 160
160 -
 161
161 -
 162
162 -
 163
163 -
 164
164 -
 165
165 -
 166
166 -
 167
167 -
 168
168 -
 169
169 -
 170
170 -
 171
171 -
 172
172 -
 173
173 -
 174
174 -
 175
175 -
 176
176 -
 177
177 -
 178
178 -
 179
179 -
 180
180 -
 181
181 -
 182
182 -
 183
183 -
 184
184 -
 185
185 -
 186
186 -
 187
187 -
 188
188 -
 189
189 -
 190
190 -
 191
191 -
 192
192 -
 193
193 -
 194
194 -
 195
195 -
 196
196 -
 197
197 -
 198
198 -
 199
199 -
 200
200 -
 201
201 -
 202
202 -
 203
203 -
 204
204 -
 205
205 -
 206
206 -
 207
207 -
 208
208 -
 209
209 -
 210
210 -
 211
211 -
 212
212 -
 213
213 -
 214
214 -
 215
215 -
 216
216 -
 217
217 -
 218
218 -
 219
219 -
 220
220 -
 221
221 -
 222
222 -
 223
223 -
 224
224 -
 225
225 -
 226
226 -
 227
227 -
 228
228 -
 229
229 -
 230
230 -
 231
231 -
 232
232 -
 233
233 -
 234
234 -
 235
235 -
 236
236 -
 237
237 -
 238
238 -
 239
239 -
 240
240 -
 241
241 -
 242
242 -
 243
243 -
 244
244 -
 245
245 -
 246
246 -
 247
247 -
 248
248 -
 249
249 -
 250
250 -
 251
251 -
 252
252 -
 253
253 -
 254
254 -
 255
255 -
 256
256 -
 257
257 -
 258
258 -
 259
259 -
 260
260 -
 261
261 -
 262
262 -
 263
263 -
 264
264 -
 265
265 -
 266
266 -
 267
267 -
 268
268 -
 269
269 -
 270
270 -
 271
271 -
 272
272 -
 273
273 -
 274
274 -
 275
275 -
 276
276 -
 277
277 -
 278
278 -
 279
279 -
 280
280 -
 281
281 -
 282
282 -
 283
283 -
 284
284 -
 285
285 -
 286
286 -
 287
287 -
 288
288 -
 289
289 -
 290
290 -
 291
291 -
 292
292 -
 293
293 -
 294
294 -
 295
295 -
 296
296 -
 297
297 -
 298
298 -
 299
299 -
 300
300 -
 301
301 -
 302
302 -
 303
303
 |
 |

37. Pensions and other post-retirement benefits continued
$ million
2010
UK
pension
plans
US
pension
plans
US other
post-
retirement
benefit
plans
Other
plans Total
Analysis of the amount charged to profit before interest and taxation
Current service costa393 241 48 120 802
Past service cost –––33
Settlement, curtailment and special termination benefits 24 – – 161 185
Payments to defined contribution plans 1 187 – 35 223
Total operating chargeb418 428 48 319 1,213
Analysis of the amount credited (charged) to other finance expense
Expected return on plan assets 1,580 465 1 178 2,224
Interest on plan liabilities (1,183) (396) (169) (429) (2,177)
Other finance income (expense) 397 69 (168) (251) 47
Analysis of the amount recognized in other comprehensive income
Actual return less expected return on pension plan assets 1,577 425 (1) 36 2,037
Change in assumptions underlying the present value of the plan liabilities (1,144) (498) (132) (489) (2,263)
Experience gains and losses arising on the plan liabilities 12 (167) (8) 69 (94)
Actuarial (loss) gain recognized in other comprehensive income 445 (240) (141) (384) (320)
aThe costs of managing the plan’s investments are treated as being part of the investment return, the costs of administering our pension plan benefits are generally included in current service cost and
the costs of administering our other post-retirement benefit plans are included in the benefit obligation.
bIncluded within production and manufacturing expenses and distribution and administration expenses.
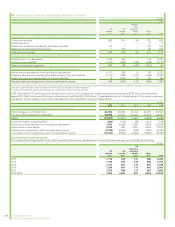
At 31 December 2012, reimbursement balances due from or to other companies in respect of pensions amounted to $732 million reimbursement
assets (2011 $546 million) and $15 million reimbursement liabilities (2011 $13 million). These balances are not included as part of the pension surpluses
and deficits, but are reflected within other receivables and other payables in the group balance sheet.
$ million
2012 2011 2010 2009 2008
History of surplus (deficit) and of experience gains and losses
Benefit obligation at 31 December 52,203 46,082 41,912 40,073 34,847
Fair value of plan assets at 31 December 38,666 34,081 34,231 31,453 26,154
Deficit (13,537) (12,001) (7,681) (8,620) (8,693)
Experience losses on plan liabilities (222) (123) (94) (421) (178)
Actual return less expected return on pension plan assets 1,651 (2,042) 2,037 2,549 (10,253)
Actual return on plan assets 4,018 460 4,261 4,528 (7,331)
Actuarial loss recognized in other comprehensive income (2,335) (5,960) (320) (682) (8,430)
Cumulative amount recognized in other comprehensive income (12,237) (9,902) (3,942) (3,622) (2,940)
Estimated future benefit payments
The expected benefit payments, which reflect expected future service, as appropriate, but exclude plan expenses, up until 2022 are as follows:
$ million
UK
pension
plans
US
pension
plans
US
other post-
retirement
benefit
plans
Other
plans Total
2013 1,115 813 167 560 2,655
2014 1,163 829 169 568 2,729
2015 1,211 847 171 567 2,796
2016 1,268 851 173 561 2,853
2017 1,276 849 173 554 2,852
2018-2022 7,059 4,003 851 2,659 14,572
244 Financial statements
BP Annual Report and Form 20-F 2012
