BP 2012 Annual Report Download - page 287
Download and view the complete annual report
Please find page 287 of the 2012 BP annual report below. You can navigate through the pages in the report by either clicking on the pages listed below, or by using the keyword search tool below to find specific information within the annual report.-
 1
1 -
2
-
3
-
4
-
5
-
6
-
7
-
8
-
9
-
10
-
11
-
12
-
13
-
14
-
15
-
16
-
17
-
18
-
19
-
20
-
21
-
22
-
23
-
24
-
25
-
26
-
27
-
28
-
29
-
30
-
31
-
32
-
33
-
34
-
35
-
36
-
37
-
38
-
39
-
40
-
41
-
42
-
43
-
44
-
45
-
46
-
47
-
48
-
49
-
50
-
51
-
52
-
53
-
54
-
55
-
56
-
57
-
58
-
59
-
60
-
61
-
62
-
63
-
64
-
65
-
66
-
67
-
68
-
69
-
70
-
71
-
72
-
73
-
74
-
75
-
76
-
77
-
78
-
79
-
80
-
81
-
82
-
83
-
84
-
85
-
86
-
87
-
88
-
89
-
90
-
91
-
92
-
93
-
94
-
95
-
96
-
97
-
98
-
99
-
100
-
101
-
102
-
103
-
104
-
105
-
106
-
107
-
108
-
109
-
110
-
111
-
112
-
113
-
114
-
115
-
116
-
117
-
118
-
119
-
120
-
121
-
122
-
123
-
124
-
125
-
126
-
127
-
128
-
129
-
130
-
131
-
132
-
133
-
134
-
135
-
136
-
137
-
138
-
139
-
140
-
141
-
142
-
143
-
144
-
145
-
146
-
147
-
148
-
149
-
150
-
151
-
152
-
153
-
154
-
155
-
156
-
157
-
158
-
159
-
160
-
161
-
162
-
163
-
164
-
165
-
166
-
167
-
168
-
169
-
170
-
171
-
172
-
173
-
174
-
175
-
176
-
177
-
178
-
179
-
180
-
181
-
182
-
183
-
184
-
185
-
186
-
187
-
188
-
189
-
190
-
191
-
192
-
193
-
194
-
195
-
196
-
197
-
198
-
199
-
200
-
201
-
202
-
203
-
204
-
205
-
206
-
207
-
208
-
209
-
210
-
211
-
212
-
213
-
214
-
215
-
216
-
217
-
218
-
219
-
220
-
221
-
222
-
223
-
224
-
225
-
226
-
227
-
228
-
229
-
230
-
231
-
232
-
233
-
234
-
235
-
236
-
237
-
238
-
239
-
240
-
241
-
242
-
243
-
244
-
245
-
246
-
247
-
248
-
249
-
250
-
251
-
252
-
253
-
254
-
255
-
256
-
257
-
258
-
259
-
260
-
261
-
262
-
263
-
264
-
265
-
266
-
267
-
268
-
269
-
270
-
271
-
272
-
273
-
274
-
275
-
276
-
 277
277 -
 278
278 -
 279
279 -
 280
280 -
 281
281 -
 282
282 -
 283
283 -
 284
284 -
 285
285 -
 286
286 -
 287
287 -
 288
288 -
 289
289 -
 290
290 -
 291
291 -
 292
292 -
 293
293 -
 294
294 -
 295
295 -
 296
296 -
 297
297 -
298
-
299
-
300
-
301
-
302
-
303
 |
 |

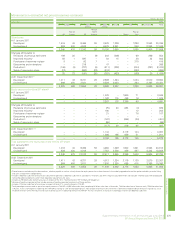
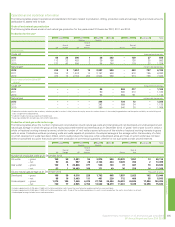
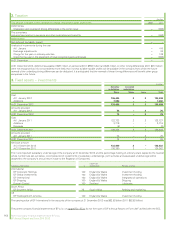
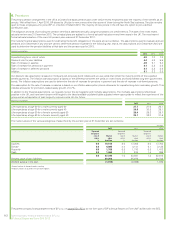
The following tables present operational and statistical information related to production, drilling, productive wells and acreage. Figures include amounts
attributable to assets held for sale.
Crude oil and natural gas production
The following table shows crude oil and natural gas production for the years ended 31 December 2012, 2011 and 2010.
Production for the yeara
Europe North
America
South
America
Africa Asia Australasia Total
UK
Rest of
Europe US
Rest of
North
America Russia
Rest of
Asia
Subsidiaries
Crude oilbthousand barrels per day
2012 86 23 390 1 28 202 – 139 27 896
2011 113 32 453 2 39 190 – 138 25 992
2010 137 40 594 7 54 246 – 119 32 1,229
Natural gascmillion cubic feet per day
2012 414 8 1,651 13 2,097 590 – 633 787 6,193
2011 355 13 1,843 14 2,197 558 – 618 795 6,393
2010 472 15 2,184 202 2,544 556 – 574 785 7,332
Equity-accounted entities (BP
share)
Crude oilbthousand barrels per day
2012 – – – – 80 – 863 217 – 1,160
2011 – – – – 90 – 865 210 – 1,165
2010 – – – – 98 – 856 191 – 1,145
Natural gascmillion cubic feet per day
2012 – – – – 394 – 734 72 – 1,200
2011 – – – – 392 – 699 34 – 1,125
2010 – – – – 399 – 640 30 – 1,069
aProduction excludes royalties due to others, whether payable in cash or in kind, where the royalty owner has a direct interest in the underlying production and the option and ability to make lifting and
sales arrangements independently.
bCrude oil includes natural gas liquids and condensate.
cNatural gas production excludes gas consumed in operations.
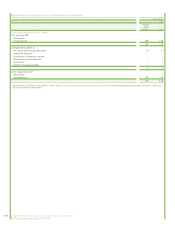
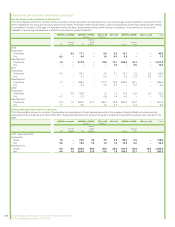
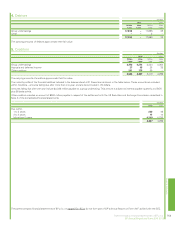
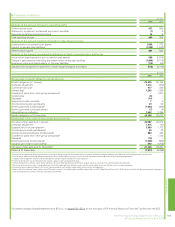
Productive oil and gas wells and acreage
The following tables show the number of gross and net productive oil and natural gas wells and total gross and net developed and undeveloped oil and
natural gas acreage in which the group and its equity-accounted entities had interests as at 31 December 2012. A ‘gross’ well or acre is one in which a
whole or fractional working interest is owned, while the number of ‘net’ wells or acres is the sum of the whole or fractional working interests in gross
wells or acres. Productive wells are producing wells and wells capable of production. Developed acreage is the acreage within the boundary of a field,
on which development wells have been drilled, which could produce the reserves; while undeveloped acres are those on which wells have not been
drilled or completed to a point that would permit the production of commercial quantities, whether or not such acres contain proved reserves.
Europe North
America
South
America
Africa Asia Australasia Total
UK
Rest of
Europe US
Rest of
North
America Russia
Rest of
Asia
Number of productive wells at 31 December 2012
Oil wellsa– gross 158 58 2,451 55 3,870 590 20,970 1,951 13 30,116
– net 90 24 987 28 2,133 434 9,409 392 2 13,499
Gas wellsb– gross 122 5 22,866 377 506 130 72 687 70 24,835
– net 52 1 10,483 186 171 49 36 256 14 11,248
Oil and natural gas acreage at 31 December 2012 Thousands of acres
Developed – gross 168 39 6,516 228 1,702 605 1,597 2,023 162 13,040
– net 85 16 3,463 111 461 220 712 400 35 5,503
Undevelopedc– gross 1,273 180 7,469 6,074 27,755 30,684 26,291 26,505 17,854 144,085
– net 730 77 4,935 4,154 14,032 18,419 11,061 9,339 13,098 75,845
aIncludes approximately 3,762 gross (1,660 net) multiple completion wells (more than one formation producing into the same well bore).
bIncludes approximately 2,557 gross (1,549 net) multiple completion wells. If one of the multiple completions in a well is an oil completion, the well is classified as an oil well.
cUndeveloped acreage includes leases and concessions.
Supplementary information on oil and natural gas (unaudited) 285
BP Annual Report and Form 20-F 2012
Financial statements
Operational and statistical information