Avon 2003 Annual Report Download - page 67
Download and view the complete annual report
Please find page 67 of the 2003 Avon annual report below. You can navigate through the pages in the report by either clicking on the pages listed below, or by using the keyword search tool below to find specific information within the annual report.-
 1
1 -
2
-
3
-
4
-
5
-
6
-
7
-
8
-
9
-
10
-
11
-
12
-
13
-
14
-
15
-
16
-
17
-
18
-
19
-
20
-
21
-
22
-
23
-
24
-
25
-
26
-
27
-
28
-
29
-
30
-
31
-
32
-
33
-
34
-
35
-
36
-
37
-
38
-
39
-
40
-
41
-
42
-
43
-
44
-
45
-
46
-
47
-
48
-
49
-
50
-
51
-
52
-
53
-
54
-
55
-
56
-
 57
57 -
 58
58 -
 59
59 -
 60
60 -
 61
61 -
 62
62 -
 63
63 -
 64
64 -
 65
65 -
 66
66 -
 67
67 -
 68
68 -
 69
69 -
 70
70 -
 71
71 -
 72
72 -
 73
73 -
 74
74 -
 75
75 -
 76
76 -
 77
77 -
78
-
79
-
80
-
81
-
82
-
83
-
84
-
85
 |
 |

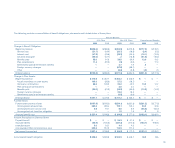
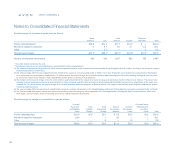
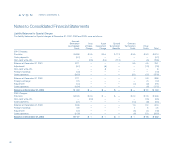
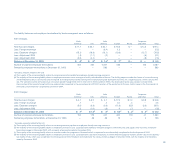
Total Assets
2003 2002 2001
North America
U.S. $ 633.7 $ 627.0 $ 637.0
U.S. Retail —19.4 17.3
Other 156.2 164.6 143.3
Total 789.9 811.0 797.6
International
Latin America 611.5 519.2 581.3
Mexico 201.7 205.7 211.0
Brazil 183.7 138.2 158.1
Europe 871.2 667.3 508.3
Pacific 462.8 426.5 393.6
Total 1,945.5 1,613.0 1,483.2
Corporate and other 826.9 903.5 900.2
Total assets $3,562.3 $3,327.5 $3,181.0
Capital Expenditures
2003 2002 2001
North America
U.S. $ 25.5 $ 21.1 $ 26.4
U.S. Retail — .2 7.1
Other 4.5 3.0 7.1
Total 30.0 24.3 40.6
International
Latin America 53.5 40.0 35.6
Mexico 20.3 21.0 13.9
Brazil 24.3 13.5 9.8
Europe 43.9 39.9 42.0
Pacific 12.8 8.2 11.9
Total 110.2 88.1 89.5
Corporate and other 22.4 14.1 25.2
Total capital expenditures $ 162.6 $ 126.5 $ 155.3
Depreciation and Amortization
2003 2002 2001
North America
U.S. $ 35.1 $ 42.5 $ 32.4
U.S. Retail .2 2.0 .5
Other 5.9 4.2 4.3
Total 41.2 48.7 37.2
International
Latin America 18.0 22.6 17.4
Mexico 7.7 12.5 7.0
Brazil 5.8 5.3 5.5
Europe 25.3 22.0 18.7
Pacific 13.5 13.7 15.3
Total 56.8 58.3 51.4
Corporate and other 25.5 17.8 20.4
Total depreciation and amortization $ 123.5 $ 124.8 $109.0
Long-Lived Assets
2003 2002 2001
North America
U.S. $ 208.5 $ 227.2 $252.5
U.S. Retail — 4.6 6.4
Other 47.0 46.1 43.4
Total 255.5 277.9 302.3
International
Latin America 191.1 145.5 162.5
Mexico 78.6 73.8 73.8
Brazil 72.8 42.8 46.2
Europe 309.8 233.1 199.9
Pacific 171.7 160.9 159.9
Total 672.6 539.5 522.3
Corporate and other 147.8 201.6 162.1
Total long-lived assets $1,075.9 $1,019.0 $986.7
Notes to Consolidated Financial Statements
notes to statements
86